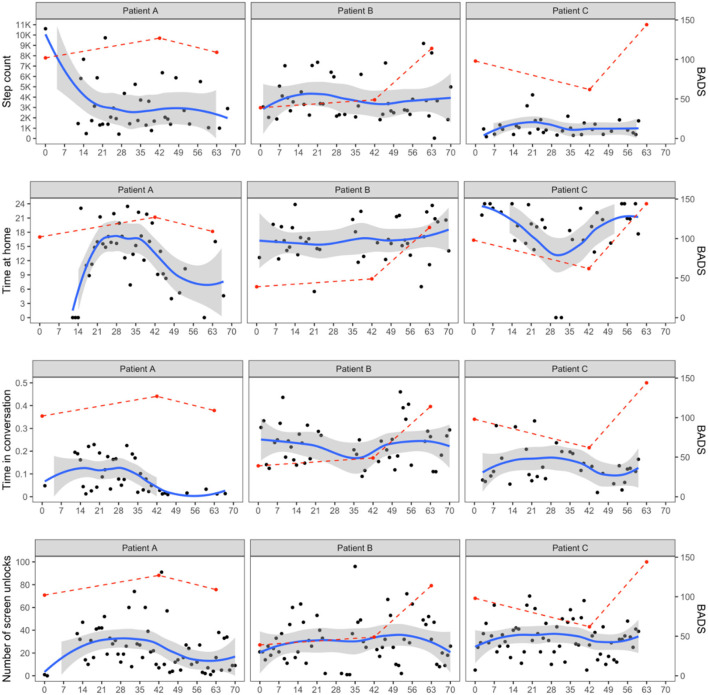
Figure 1.
Passive sensing data fluctuations over treatment. BADS, Behavioral Activation for Depression Scale. Columns represent patients and rows represent different smartphone data (step count, time spent at home, time in conversation, and the number of screen unlocks). For all panels, the x-axis shows time in days. Points in black represent daily recorded smartphone data and a blue line with a shaded band is a smooth local polynomial regression (LOESS) curve with its 95% confidence interval. Points and a dashed line in red show the fluctuations in BADS scores from baseline, weeks 6 to 9 (end of treatment).

