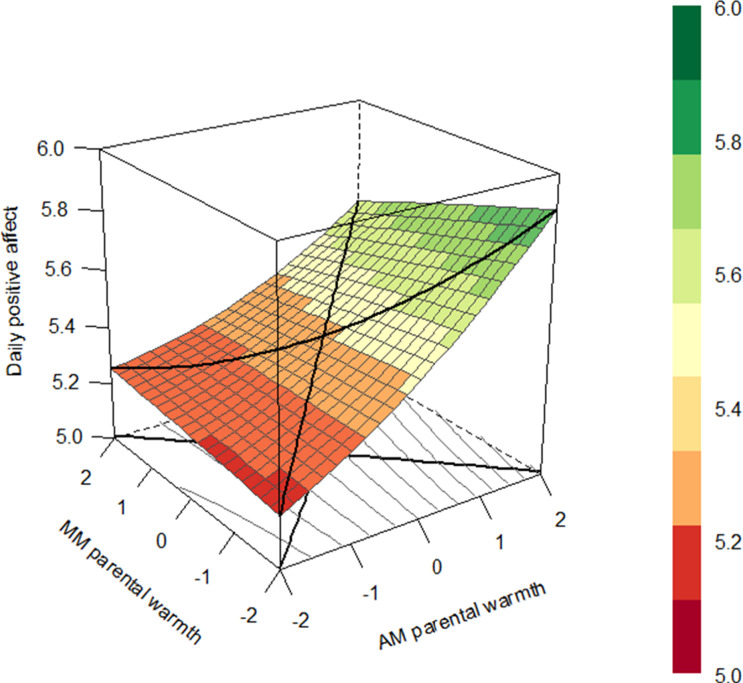
Fig. 5.

Response surface plot illustrating the association between adolescents’ and mothers’ reports of daily parental warmth and adolescent daily positive affect with a significant line of congruence and line of incongruence for the average dyad. Note. Centered scores of daily parental warmth of adolescents and mothers are presented on the x-axis, daily positive affect is presented on the y-axis. The colors in the legend represent the amount of daily positive affect which is also shown in the figure
