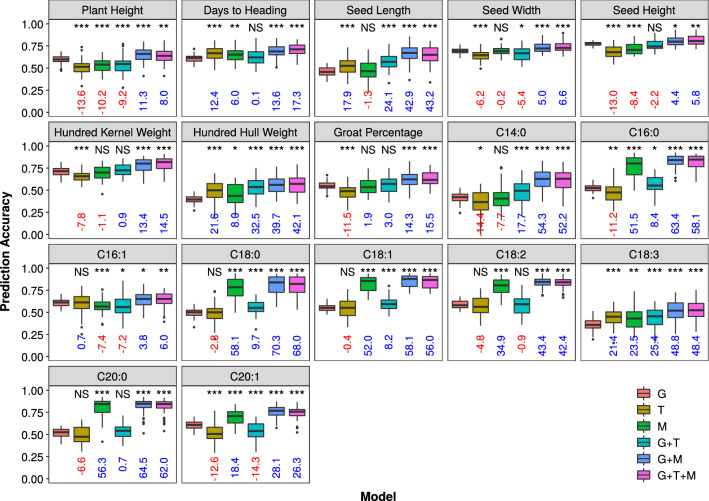
Fig. 2.
Distribution of prediction accuracy of the 17 phenotypic traits in the Diversity panel across 50 re-sampling runs. For each trait, boxplots with different colors represent prediction models. Medians of percent change in prediction accuracy of omics models relative to GBLUP are indicated below each box in blue if positive and in red if negative. The Wilcoxon Signed Rank was applied to test difference in prediction accuracy between each omics model and the GBLUP model, and significance levels are indicated above each box. *** = significant at P < 0.001, ** = significant at P < 0.01, * = significant at P < 0.05, NS = not significant. G = genomic BLUP, T = transcriptomic BLUP, M = metabolomic BLUP

