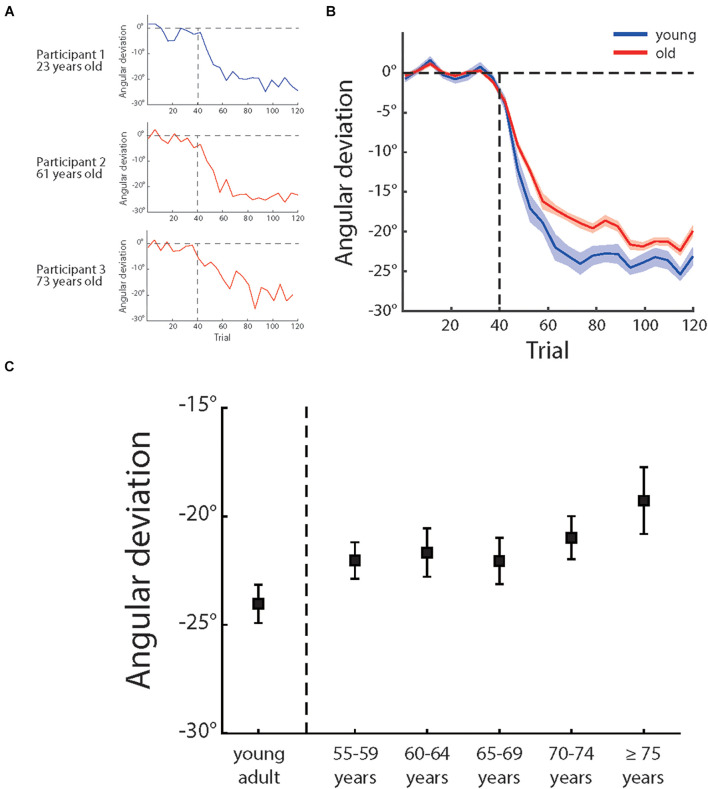
FIGURE 3.
(A) Illustrates the angular deviation as a function of trial number of three sample participants of different age groups and (B) illustrates the mean angular deviation as a function of trial number of young adults (blue) and older people (red). The shadow areas depict ± 1 standard errors, (C) illustrates the mean angular deviation of last 15 adaptation trials of different age groups (for each group, n = 20). The error bars depict ± 1 standard errors.

