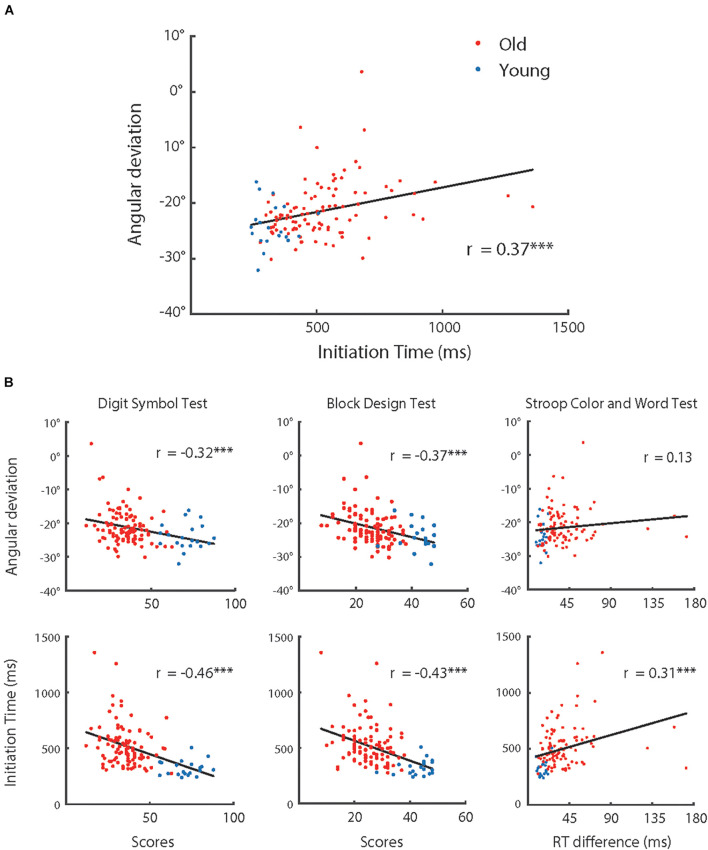
FIGURE 7.
(A) Adaptive angular deviation as a function of initiation time of hand movement, (B) adaptive angular deviation (upper row) and initiation time of hand movement (lower row) as functions of performance in cognitive tests (left: Digital Symbol Test; middle: Block Design Test; and right: Stroop Color and Word Test), respectively. The red dots represent the group of older participants (n = 100) and the blue dots represent the group of younger participants (n = 20). The solid lines indicate linear regression model fits and rs represent the Pearson correlations between variables. Note, ∗∗∗p < 0.001.

