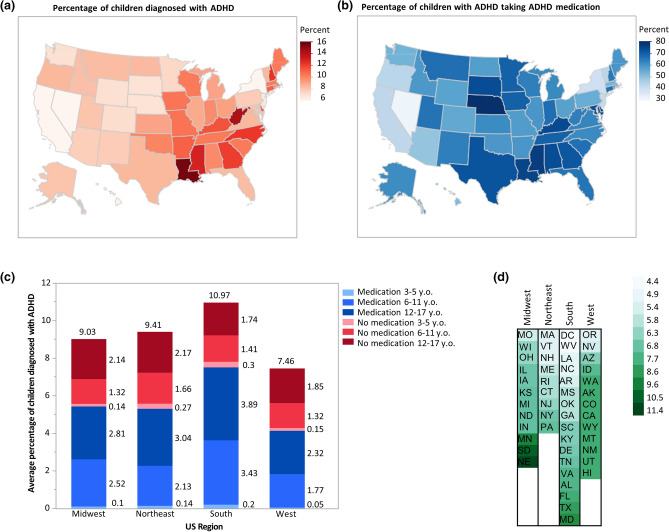
Figure 1.
Distribution of parent-reported ADHD prevalence and medication throughout the United States. United States map showing percentages by state of (a) children aged 3–17 years currently diagnosed with ADHD and (b) children with ADHD currently taking ADHD medication. Darker shades indicate states with relatively higher percentages, and lighter shades indicate states with relatively lower percentages. California (5.6%) has the lowest percentage, Nevada (5.9%) has the second-lowest percentage, and Louisiana (15.7%) has the highest percentage of children who currently have ADHD. Nevada (32.2%) has the lowest percentage, Nebraska (81.76%) has the highest percentage, and Louisiana has the third-highest percentage (76.28%) of children with ADHD currently taking ADHD medication. Percentages of diagnosis and medication were mapped onto the U.S. states using the map function of the graph builder in JMP 14.3.0. (c) Compared to the Midwest (n = 11,946) and Northeast (n = 9,102), regional state averages of children diagnosed with ADHD are highest in the South (n = 17,889) and lowest in the West (n = 12,979). Red indicates children diagnosed with ADHD who are not receiving medication. Blue indicates children diagnosed with ADHD who receive medication. Darker shades of both gradients indicate children in older age brackets. (d) Cell plot of states ordered lowest (top) to highest (bottom) by region as ratios of the percent of children aged 3–17 years diagnosed with ADHD taking medication to the percent of all children aged 3–17 years diagnosed with ADHD. Darker shades of green indicate higher ratios relative to other states. There are 12 states in the Midwest, 9 states in the Northeast, 17 states in the South, and 13 states in the West. Data were collected from the National Survey of Children’s Health (NSCH) 2018–19 combined dataset.

