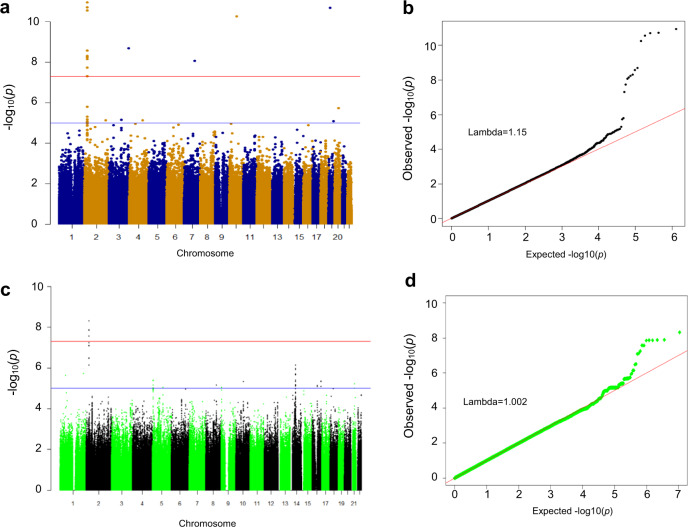
Fig. 3. GWAS of follistatin in the MDC-CC and SUMMIT-VIP cohort.
a Manhattan plot (−log10 GWAS plot) of GWAS on plasma follistatin in individuals of MDC-CC cohort (n = 4195). The most significant SNPs in this analysis are rs780094, rs780093, and rs1260326 in the GCKR gene (glucokinase regulatory protein). b Quantile-quantile (QQ) plot of the data shown in the Manhattan plot in a. c Manhattan plot (−log10 GWAS plot) of GWAS on plasma follistatin in individuals of SUMMIT cohort (n = 885). The most significant SNP in this analysis is rs1260326 in the GCKR gene. d Quantile-quantile (QQ) plot of the data shown in the Manhattan plot in c. The genome-wide significance level is set at 5 × 10⁻⁸ and plotted as the dotted line.

