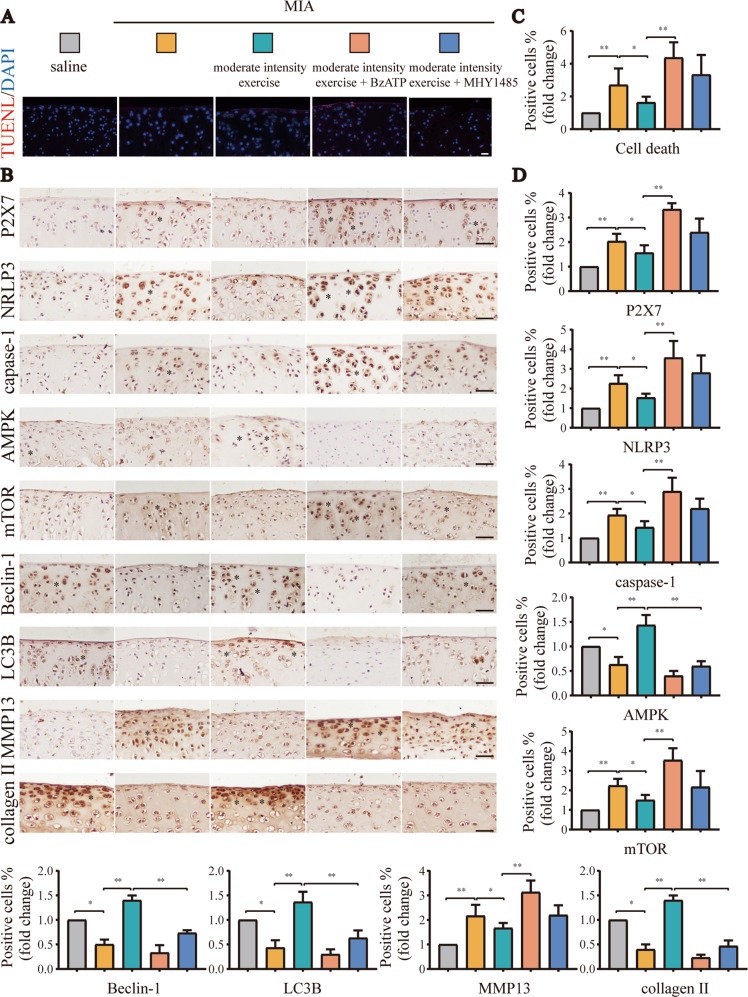
Fig. 3. Supplement to Fig. 2.
A TUNEL assays were used to detect cell death in tissue sections from each group. Red: dead cells; blue: nuclei stained by DAPI (scale bar: 50 μm). B IHC was used to detect the expression levels of P2X7, NLRP3, caspase-1, mTOR, AMPK, LC3B, and Beclin-1 in tissue sections from each group. Brown: stained cells; blue: hematoxylin-stained nuclei (scale bar: 500 μm). C Statistical data for cell death in TUNEL assays. D Statistical data for stained cells in IHC analyses. The * in the histochemical images represents the positively stained cells. Data are presented as means ± standard deviations of at least three independent experiments. *p < 0.05, **p < 0.01.

