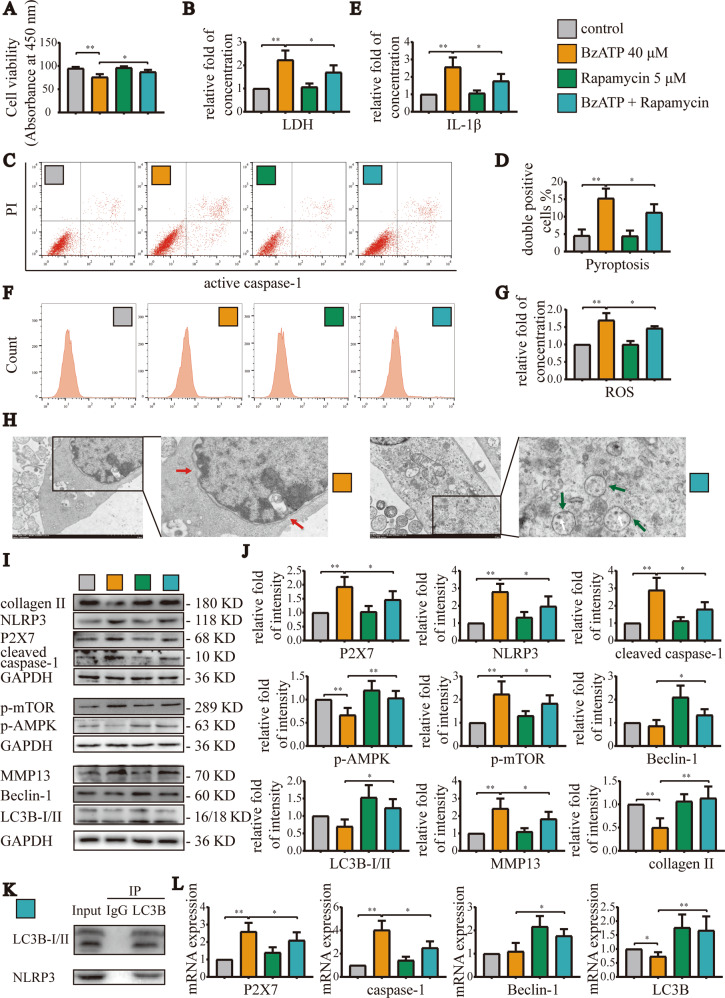
Fig. 7. Increasing the level of autophagy effectively blocked pyroptosis induced by excessive activation of P2X7.
A CCK-8 assays were used to detect cell viability for each group. Absorbance was measured at a wavelength of 450 nm. B LDH release assays were used to detect the degree of cell damage. C, F Flow cytometry was used to detect the number and ratio of caspase-1/PI- and ROS-stained cells, reflecting the severity of cell pyroptosis and ROS production. D, G Statistical data for stained cells. In the statistical analysis of ROS, we used the control group as a reference to normalize the absorbance value and expressed the results as the fold change. E ELISA was used to detect IL-1β content in cell culture supernatants for each group. H TEM analysis of cell morphology, including cell membrane rupture, nuclear membrane atrophy (red arrow), and autolysosome number (white arrow), reflecting the level of cell pyroptosis and autophagy (green arrow, autophagosome) (scale bar: 2 μm). K Co-IP experiments demonstrating the binding of LC3B and NLRP3. I, J Western blotting and L RT-qPCR were used to detect the protein and mRNA expression levels of P2X7, NLRP3, caspase-1, mTOR, AMPK, LC3B, Beclin-1, MMP13, and collagen II. Data are presented as means ± standard deviations of at least three independent experiments. *p < 0.05, **p < 0.01.

