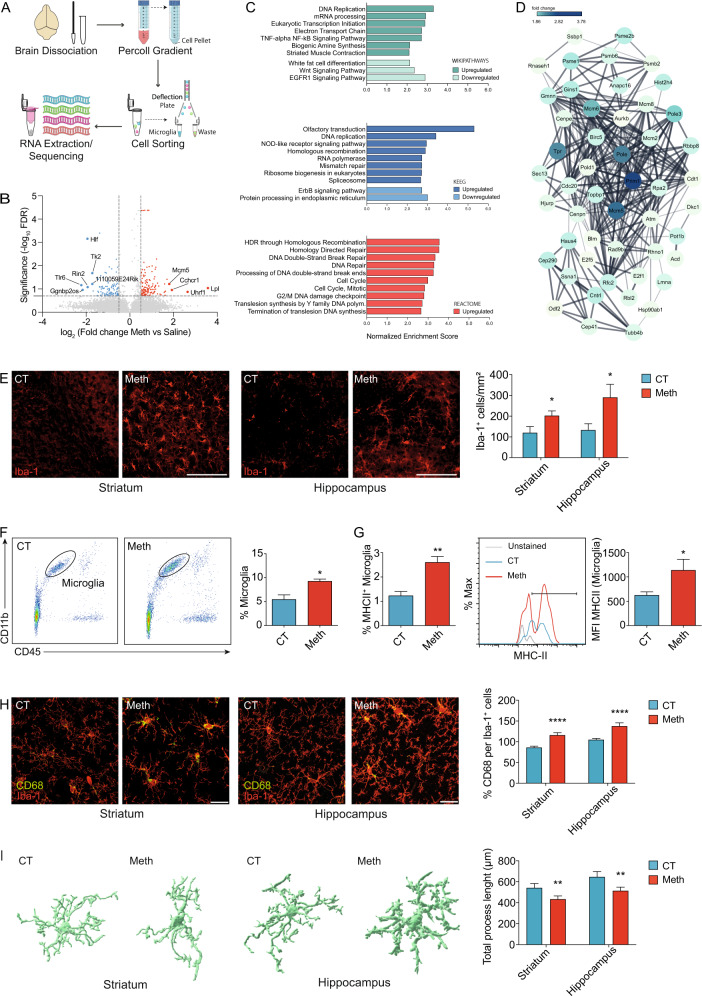
Fig. 1. Meth triggers microglial activation in the brain.
A Schematic representation of conducted workflow of microglial cell sorting and sequencing. B Volcano plot depicting differentially expressed genes of isolated microglia from brains of mice administered with binge Meth vs Saline (n = 3 mice per group). Non-differentially expressed genes are shown with gray dots, red dots represent significantly upregulated genes and blue dots represent downregulated genes. C Top 10 enriched pathways revealed by Wikiphatways, KEEG and Reactome databases using Gene Set Enrichment Analysis (GSEA). D A network analysis of enriched gene sets involved in the cell cycle. The network represents the top 50 upregulated genes related to cell cycle, upon Meth treatment. E Representative confocal imaging of striatal and hippocampal sections from mice administered with binge Meth or saline (CT) and immunostained for Iba1. Graph displays (mean and SEM) the number of Iba1+ cells per area (3–4 sections/animal from n = 3 mice per group). *p < 0.05, two-way ANOVA showing only a significant effect for treatment, followed by the two-stage linear step-up procedure of Benjamini, Krieger and Yekutieli. Scale bars 50 μm. F Flow cytometry analyses of microglia cells (CD11b + CD45low) isolated from the brains of mice administered with binge Meth or saline (CT) (n = 5 mice per group). The graph displays (mean and SEM) the percentage of microglial cells. *p < 0.05 (unpaired t test). G Expression of MHCII by flow cytometry in microglia (CD11b + CD45low) isolated from the brains of mice administered with binge Meth or saline (CT) (n = 5 mice per group). Graphs display (means and SEM) the percentage of microglial cells expressing the MHCII marker and the mean fluorescence intensity (MFI) of MHCII in microglial cells. *p < 0.05, **p < 0.01 (unpaired t test). H Representative confocal imaging of striatal and hippocampal sections from mice administered with binge Meth or saline (CT) and immunostained for Iba1 (red) and CD68 (green). Graph displays (mean and SEM) the percentage of CD68 expression per Iba1+ cells (at least 30 cells were quantified from each animal; n = 3 mice per group). ****p < 0.0001 (CT vs Meth), two-way ANOVA (treatment x region) revealed also a significant effect of the region (p < 0.001). The two-stage linear step-up procedure of Benjamini, Krieger, and Yekutieli was used as a pos-hoc. Scale bars 20 μm. I Imaris (Bitplane)-based three-dimensional reconstructions of representative microglia from striatal and hippocampal sections obtained from mice administered with binge Meth or saline (CT). Graph displays (mean and SEM) of Imaris-based automated quantification of microglial total process length (13–17 cells/group from n = 3 mice per group). **p < 0.01 (CT vs Meth), two-way ANOVA (treatment x region) revealed also a significant effect for the region (p < 0.05). The two-stage linear step-up procedure of Benjamini, Krieger, and Yekutieli was used as a pos-hoc.

