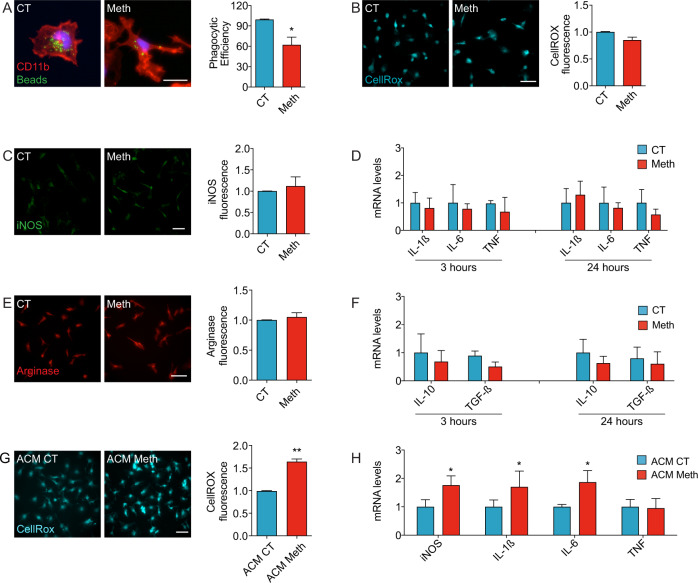
Fig. 2. Microglia activation triggered by Meth requires Astrocytes.
A Fluorescence imaging of CD11b (red) in primary microglia incubated with microbeads (green) and treated with 100 μM Meth for 24 h (n = 3 independent cultures). Graph (means and SEM) displays phagocytic efficiency. *p < 0.05 (unpaired t test). Scale bar 10 μm. B Fluorescence imaging of primary microglia incubated with the CellROX® green reagent and treated with 100 μM Meth for 24 h (n = 3 independent cultures). Graph (means and SEM) displays the CellROX® intensity normalized to the control values (unpaired t test). Scale bar 10 μm. C Fluorescence imaging of primary microglia immunolabeled for iNOS (green) treated with 100 μM Meth for 24 h (n = 3 independent cultures). Graph (means and SEM) displays iNOS intensity normalized to the control values (unpaired t test). Scale bar 10 μm. D qRT-PCR for IL-1β, IL-6, or TNF from primary microglia treated with 100 μM Meth for 3 h or 24 h (n = 3 independent cultures). Graphs (means and SEM) display the indicated transcripts’ mRNA expression levels (unpaired t test). E Fluorescence imaging of arginase in primary microglia treated with 100 μM Meth for 24 h (n = 3 independent cultures). Graph (means and SEM) displays arginase intensity normalized to the control values (unpaired t test). Scale bar 10 μm. F qRT-PCR for IL-10 or TGFβ from primary microglia treated with 100 μM Meth for 3 h or 24 h (n = 3 independent cultures). Graphs (means and SEM) display the indicated transcripts’ mRNA expression levels (unpaired t test). G Fluorescence imaging of primary microglia exposed to conditioned media obtained from primary astrocytes treated with 100 μM Meth (ACM Meth) or not (ACM CT) for 24 h and incubated with CellROX® green reagent (n = 3 independent cultures). Graph (means and SEM) displays the CellROX® intensity normalized to the ACM CT values **p < 0.01 (unpaired t test). Scale bar 10 μm. H qRT-PCR for iNOS, IL-1β, IL-6, or TNF from primary microglia exposed to ACM CT or ACM Meth for 24 h (n = 3–5 independent cultures). Graphs (means and SEM) display the mRNA levels for the indicated transcripts. *p < 0.05 (unpaired t test).

