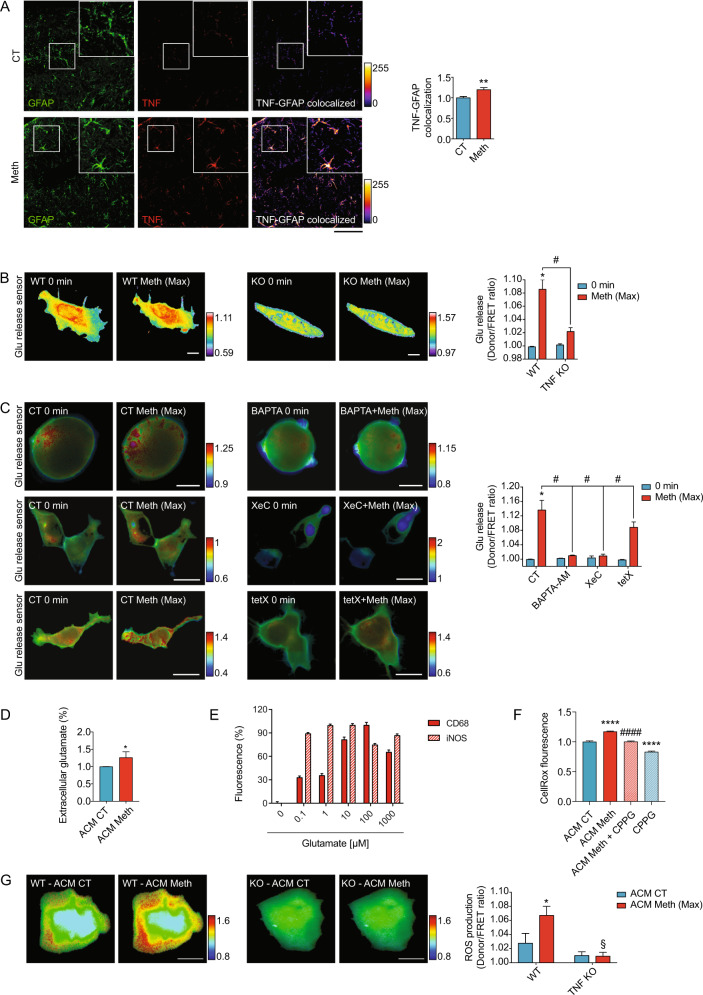
Fig. 3. Meth activates microglia via astrocytic TNF production.
A Confocal imaging of hippocampal sections from mice treated with Meth or saline (CT) and immunostained for GFAP (green) and TNF (red). Graph displays (means and SEM) the GFAP/TNF colocalization puncta normalized to the CT values (3–4 sections per animal from n = 3 mice per group). **p < 0.01 (unpaired t test). Scale bar 50 μm. B Primary astrocytes from WT or TNF KO mice expressing the glutamate release FRET biosensor (FLIPE) were exposed to Meth 100 µM. Time-lapses of CFP/FRET ratio changes for the FLIPE biosensor (normalized at 0 min) show the maximum effect of Meth in both genotypes and are coded according to the scale (n = 3–8 cells pooled across 2–3 independent experiments). *p < 0.05 (two-way ANOVA vs WT 0 min); #p < 0.05 (two-way ANOVA vs WT Meth). Scale bars 10 μm. C Primary astrocytes expressing the glutamate release FRET biosensor (FLIPE) were exposed to Meth, BAPTA-AM (10 µM) + Meth 100 µM (upper panels), XestosponginC (XeC; 500 nM) + Meth 100 µM (middle panels) or Tetanus toxin (Tet; 500 nM) + Meth (bottom panels). Time-lapses of CFP/FRET ratio changes for the FLIPE biosensor (normalized at 0 min) show the maximum effect of Meth and are coded according to the scale (n = 5–7 cells pooled across 3 independent experiments). *p < 0.05 (two-way ANOVA vs WT 0 min); #p < 0.05 (two-way ANOVA vs WT Meth). Scale bars 10 μm. D Glutamate concentration in the culture supernatant from CT astrocytes (ACM CT) or treated with Meth for 24 h (ACM Meth) was quantified by ELISA. Graph displays (means and SEM) of glutamate concentration, normalized to control values (n = 4 independent cultures). The concentration of glutamate on ACM CT was 18.05 ± 2.23 µM. E Primary microglia cells were treated with a range of glutamate concentrations (0.1 µM, 1 µM, 10 µM, 100 µM, and 1 mM). Graph displays (means and SEM) for CD68 and iNOS intensity normalized to untreated cells (0.0 µM). One-way ANOVA revealed a significant effect of glutamate concentration: p < 0.0001 for CD68 intensity and p < 0.0001 for iNOS intensity. F Primary microglia cells were treated with ACM CT, ACM Meth alone or pre-treated with 100 µM of (RS)-α-Cyclopropyl-4-phosphonophenylglycine (CPPG, 30 min before ACM Meth) and CPPG alone (100 µM). Evaluations were conducted at 24 h of exposure (n = 2 independent cultures). Graph displays (means and SEM) ROS production (CellRox) normalized to ACM CT. ****p < 0.0001 (vs ACM CT), ####p < 0.0001 (vs ACM Meth) One-way ANOVA and Tukey pos-hoc. G Primary microglia from WT or TNF KO mice expressing the ROS FRET biosensor HSP were incubated with ACM CT and then exposed to ACM Meth 100 µM. Time-lapses of CFP/FRET ratio changes for the HSP biosensor (normalized at 0 min) show the maximum effect of Meth and are coded according to the scale (n = 4 cells pooled across two independent experiments). *p < 0.05, §non-significant. Scale bars 10 μm.

