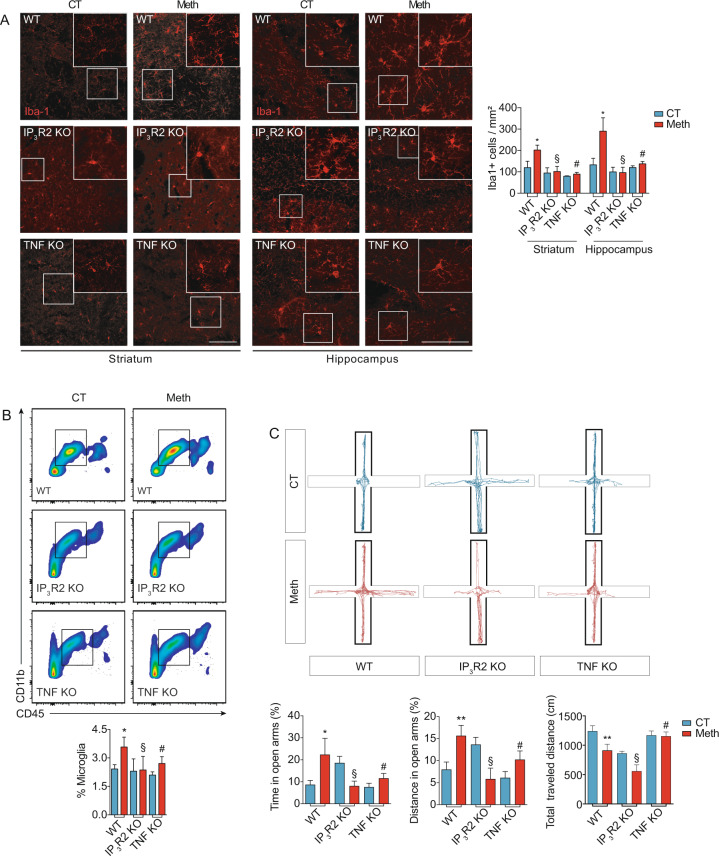
Fig. 4. TNF or IP3R2 deficiency prevents Meth-induced microgliosis and behavioral changes.
A Confocal imaging of striatal and hippocampal sections from WT, IP3R2 KO, or TNF KO mice administered with binge Meth or saline (3–4 sections/animal from n = 3 mice per group) and immunostained for Iba1. Graph (means and SEM) displays the number of Iba1+ cells *p < 0.05 WT-CT vs. WT-Meth; §non-significant (IP3R2 KO-CT vs. IP3R2 KO-Meth and #non-significant TNF KO-CT vs. TNF KO-Meth). Two-way ANOVA followed by the two-stage linear step-up procedure of Benjamini, Krieger and Yekutieli. Scale bars 50 μm. B Flow cytometry analysis of microglia cells (CD11b+ CD45low) isolated from WT, IP3R2 KO, or TNF KO mice adminitered with Meth or saline (CT) (n = 5–9 animals per group). The graph displays the percentage of microglia cells with mean and SEM. *p < 0.05 WT-CT vs. WT-Meth; §non-significant IP3R2 KO-CT vs. IP3R2 KO-Meth and #non-significant TNF KO-CT vs. TNF KO-Meth. Two-way ANOVA followed by the two-stage linear step-up procedure of Benjamini, Krieger and Yekutieli. C WT, IP3R2 KO, and TNF KO animals were evaluated in the EPM 24 h after a binge pattern of Meth or saline (CT) administration (n = 6–13 animals per group). Graphs display (means and SEM) CT and Meth-treated mice displayed significant differences in time spent in open arms (OA), distance traveled in OA and in total traveled distance. *p < 0.05 or **p < 0.01, WT-CT vs. WT-Meth; §non-significant IP3R2 KO-CT vs. IP3R2 KO-Meth and #non-significant TNF KO-CT vs. TNF KO-Meth. Two-way ANOVA followed by the two-stage linear step-up procedure of Benjamini, Krieger, and Yekutieli.

