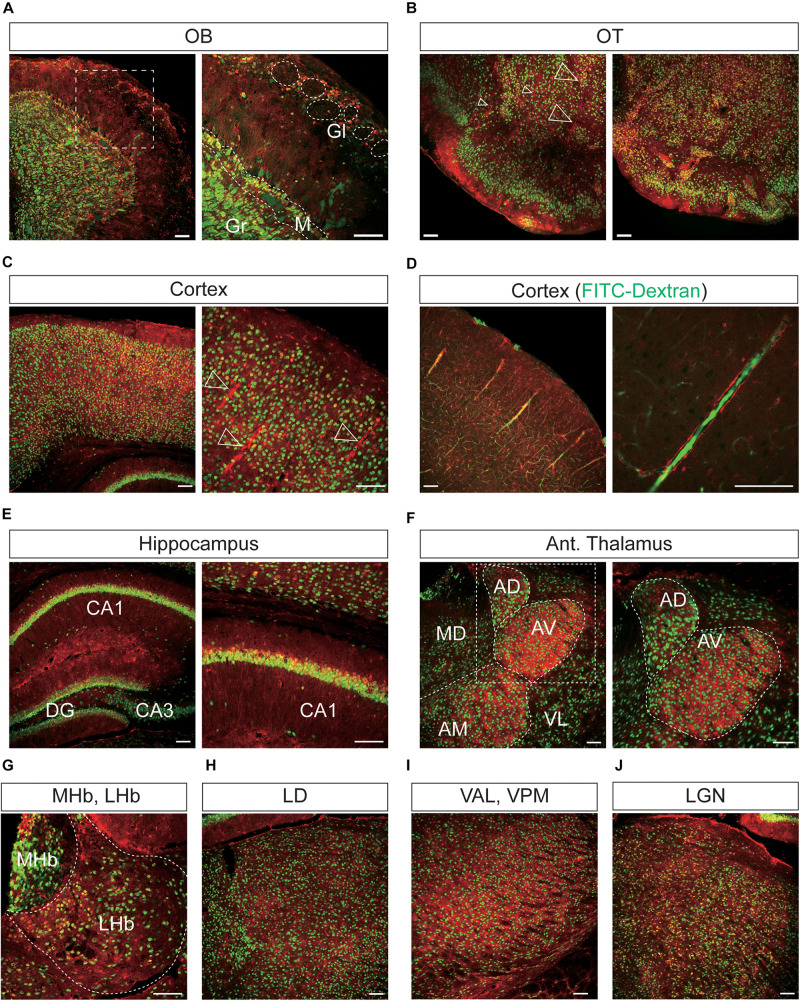
FIGURE 6.
Representative confocal images showing tdTomato fluorescence in the olfactory bulb, cerebral cortex, and thalamus of T1r2-tdTomato mice. (A) Olfactory bulb (OB). Glomeruli (Gl), mitral layer (M), and granular layer (Gr) are indicated with white dotted lines, (B) olfactory tubercle (OT), (C) cortex, (D) cortex. FITC-Dextran (green). (E) In the hippocampus, Cornu Ammonis area 1 (CA1), CA3, and the dentate gyrus (DG) are labeled. (F) Anterior thalamus. Left: Anterodorsal (AD), anteroventral (AV), anteromedial (AM), mediodorsal (MD), and ventrolateral (VL) nuclei are labeled; Right: magnified images of the white dotted box in the left image, (G) medial (MHb) and lateral habenula (LHb), (H) laterodorsal nucleus (LD) of the thalamus, (I) ventroanterolateral (VAL) and ventroposterior medial (VPM) nuclei of the thalamus, and (J) lateral geniculate nucleus (LGN). White dotted lines indicate the borders of nearby areas. White empty triangles indicate vascular structures. Anti-NeuN signals [green except for panel (D)]; tdTomato (red). Scale bar, 100 μm.

