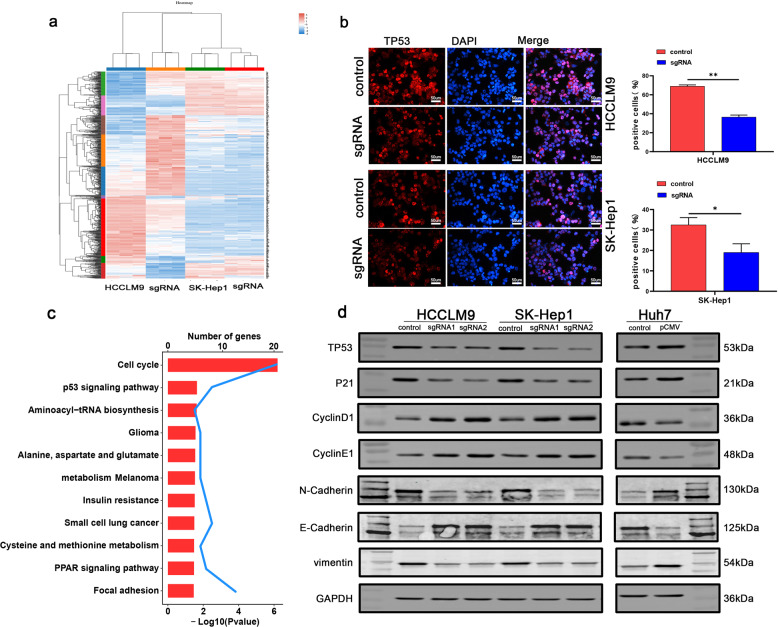
Fig. 5. SNORA42 through the p53 signaling signal pathway.
a RNA-Seq data of the control and SNORA42-knockdown HCCLM9 and SK-Hep1 cells showing the differentially expressed genes. The up- and downregulated genes in the experimental group relative to the control group are shown in shades of red and blue respectively. b Representative immunofluorescence images showing the in-situ expression of p53 in HCCLM9 and SK-Hep1 cells after SNORA42 knockdown. *p < 0.05; **p < 0.01. c KEGG enrichment analysis showing significant enrichment of cell cycle and p53 signaling pathways among the DEGs. d Representative immunoblots showing the expression levels of the indicated proteins in SNORA42-knockdown HCCLM9 and SK-Hep1 cells and SNORA42-overexpressing Huh7 cells.

