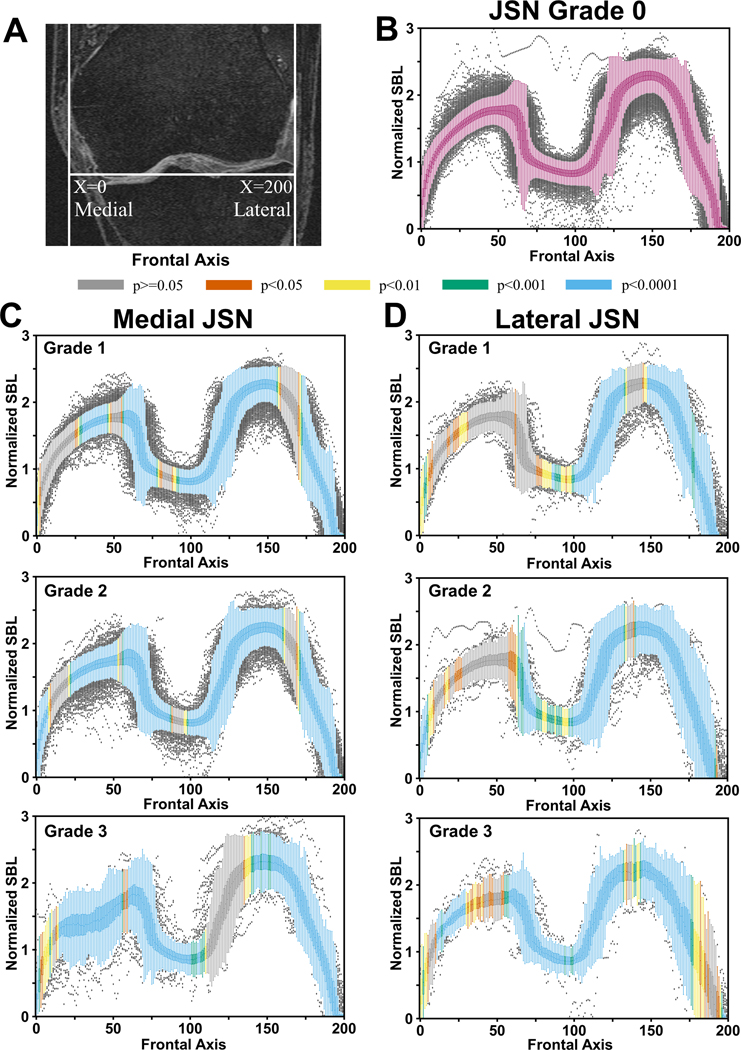
Figure 2: Distribution of subchondral bone lengths on the femur.
(A) Placement of the normalized x-axis on the MRI slices. For each location on the x-axis shown in the coronal plane, subchondral bone lengths (SBLs) were computed on the sagittal slices for all the knees. A total of 200 locations were chosen along the frontal axis. (B) Box plots containing the normalized femoral SBLs for JSN=0. (C) Normalized SBL values plotted along the frontal axis for different grades of medial JSN. (D) Normalized SBL values plotted along the frontal axis for different grades of lateral JSN. The SBL normalization was performed by dividing the SBL estimated per slice with the summation of all the femur and tibial SBLs for a given knee. The color coding on the box plots at every location denote the p-value computed using the corresponding location on the JSN=0 plot as the reference.

