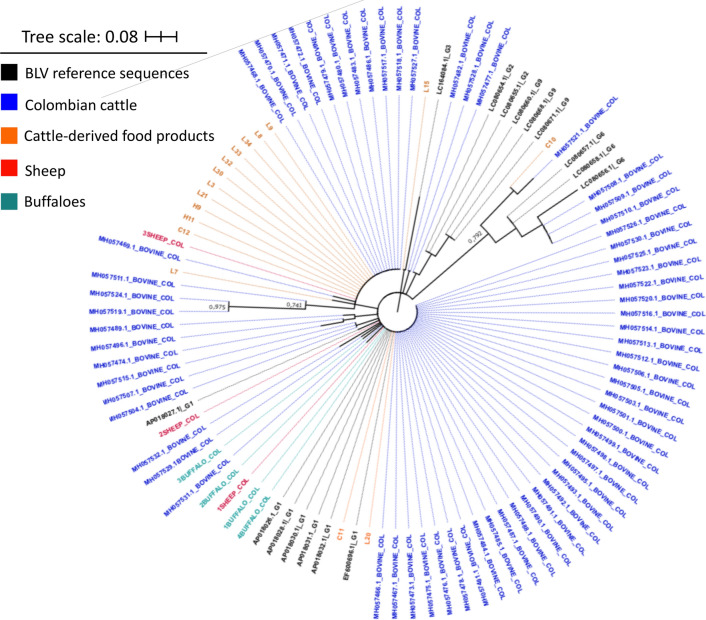
Fig. 4.
Unrooted maximum-likelihood phylogenetic tree obtained using a multiple alignment of the complete data set (n = 104 sequences) produced using ClustalW and the Tamura-Nei model [52]. A region of the tax gene is shown. A discrete gamma distribution was used to model evolutionary rate differences among sites: 5 categories, +G parameter = 0.4839. Colors indicate the source of the BLV sequence as follows: black, BLV reference sequences; blue, cattle (blood); orange, cattle (food products, milk and beef); red, sheep; teal, buffaloes

