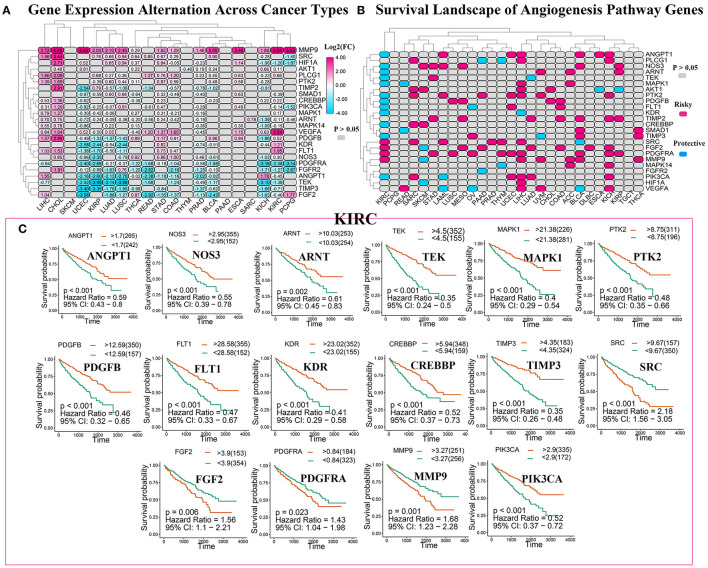
Figure 3.
The roles of angiogenesis pathway genes in cancer. (A) The changes in the expression of 24 angiogenesis pathway genes among 32 tumor types. The color code bar on the right side shows the corresponding value of log2(FC). And negative changes are displayed in blue, and positive changes are displayed in red. The P > 0.05 indicates no statistical significance and is displayed in gray. (B) Heatmap showed the survival landscape of angiogenesis pathway genes. Blue represents the protective genes and red represents risky genes. The gray bar represents no statistical significance. (C) The survival curve of angiogenesis pathway genes in kidney renal clear cell carcinoma (KIRC). We divided the genes into the high-expression and low-expression groups based on the best cut-off values using the “survminer” package and then plotted the survival curve. The orange line represents the high-expression groups; the green line represents the low-expression groups. The abscissa represents the number of days, and the ordinate represents the survival probability.

