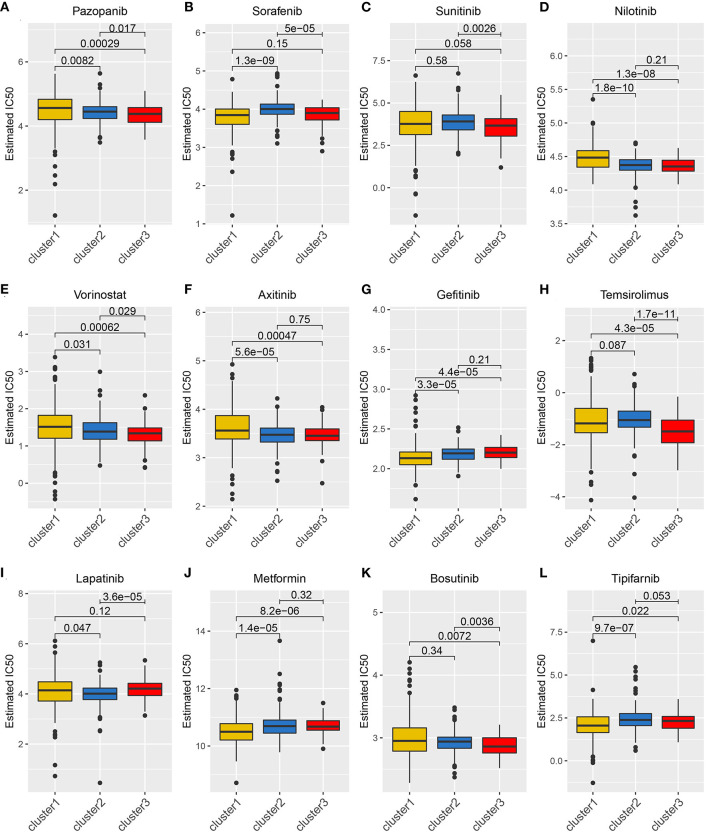
Figure 5.
The relationship between drug sensitivity and the angiogenesis clusters. The box plots of the estimated IC50 for 12 types of common chemotherapeutic agents are shown in (A–L) for cluster 1 (yellow), cluster 2 (blue), and cluster 3 (red). The 12 types of chemotherapeutic agents are pazopanib, sorafenib, sunitinib, nilotinib, vorinostat, axitinib, gefitinib, temsirolimus, lapatinib, metformin, bosutinib, and tipifarnib. The P-values are displayed above the clusters and the P < 0.05 were considered statistically significant. The box plots showed drug sensitivities among the angiogenesis clusters were different.

