Figure 6.
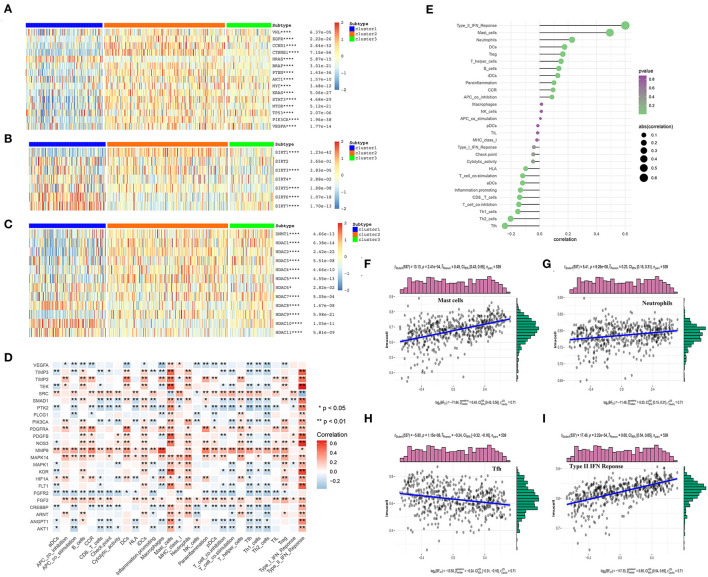
The correlations between the angiogenesis score and the classical cancer-related genes or immune cell infiltration. (A–C) Heatmap shows that the angiogenesis-score is correlated with other signaling pathways in KIRC. (A) The correlation with oncogenes and tumor suppressor genes. (B) The correlation with sirtuin family genes. (C) The correlation with histone deacetylases (HDAC) family genes. The statistical method used in A–C is “ANOVA” (*p < 0.05, **p < 0.01, ***p < 0.005, and ****p < 0.001). (D) The heat map shows that the correlation between the angiogenesis pathway genes and immune cells infiltration. The “ggplot2” and “dplyr” packages in R Studio were then used to draw the heat map, with Spearman's correlation coefficient being applied for the statistical analysis. Red represents positive correlation and blue represents negative correlation (*p < 0.05 and **p < 0.01). (E) The plot shows the correlation between the angiogenesis-score and immune cells infiltration. On the right side of the plot, the area of the sphere represents the degree of abs (correlation) and the color indicates the p-value. (F–I) The scatter diagram shows the correlation between the angiogenesis-score and four immune-infiltration-related substances. The angiogenesis-score was found to be positively correlated with the infiltration of type II IFN response cells, mast cells, and neutrophils, and negatively correlated with that of Tfh cells.

