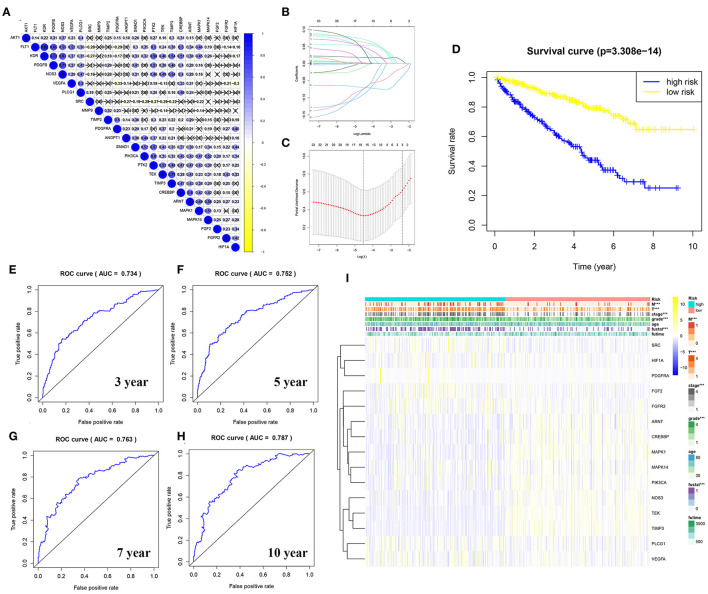
Figure 7.
Construction of a risk model using the least absolute shrinkage and selection operator (LASSO)–Cox regression analysis. (A) The plot shows the result of co-expression relationships of 24 angiogenesis pathway genes in KIRC. In the color bar on the right side, blue represents positive correlation and yellow represents negative correlation. (B) The LASSO coefficient profiles of angiogenesis pathway genes in KIRC. (C) The distribution and median value of the risk scores. Fifteen genes were screened by LASSO Cox regression analysis. (D) The survival curve was obtained based on this model. The overall survival rates of patients in the high-risk group were significantly lower than those of the patients in the low-risk group. Blue represents the high-risk group and yellow represent the low-risk group. (E–H) ROC curve of 3-, 5-, 7-, and 10-years, area under the curve (AUC) of the curve are 0.734, 0.752, 0.763, and 0.787, respectively. (I) The correlation of risk score and the clinicopathological characteristics. The color bar shows the expression of genes. Yellow represents the upregulation of genes, blue represents the downregulation of genes (***p < 0.001).

