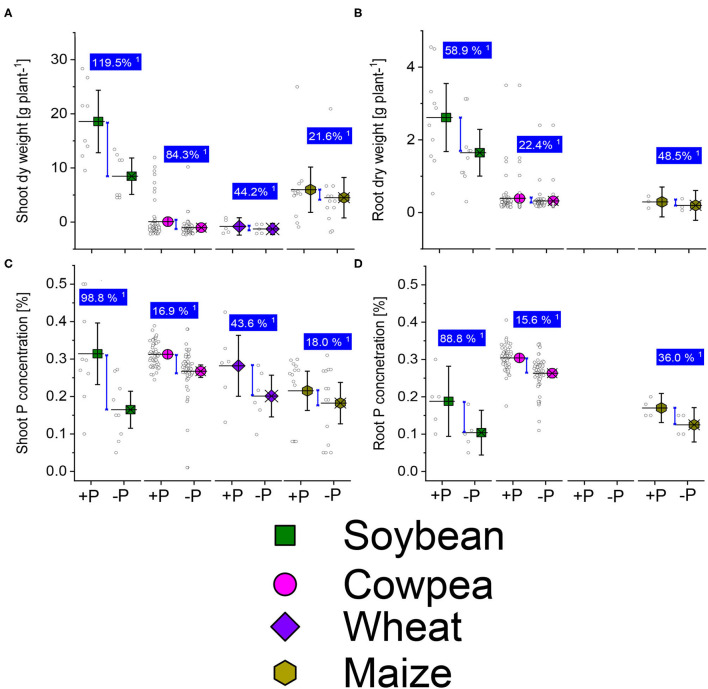
Figure 4.
Boxplots and scatter data of shoot (A) root (B) dry weights, shoot-P (C) and root-P (D) internal concentrations under +P and −P under drought or water deficit conditions of soybean, cowpea, wheat, and maize plants. 1Average change (%) of the +P applied over P-deficient plants. Means + bootstrap at 95% CIs of two tested P treatments that do not overlap indicate a significant relative increase difference.

