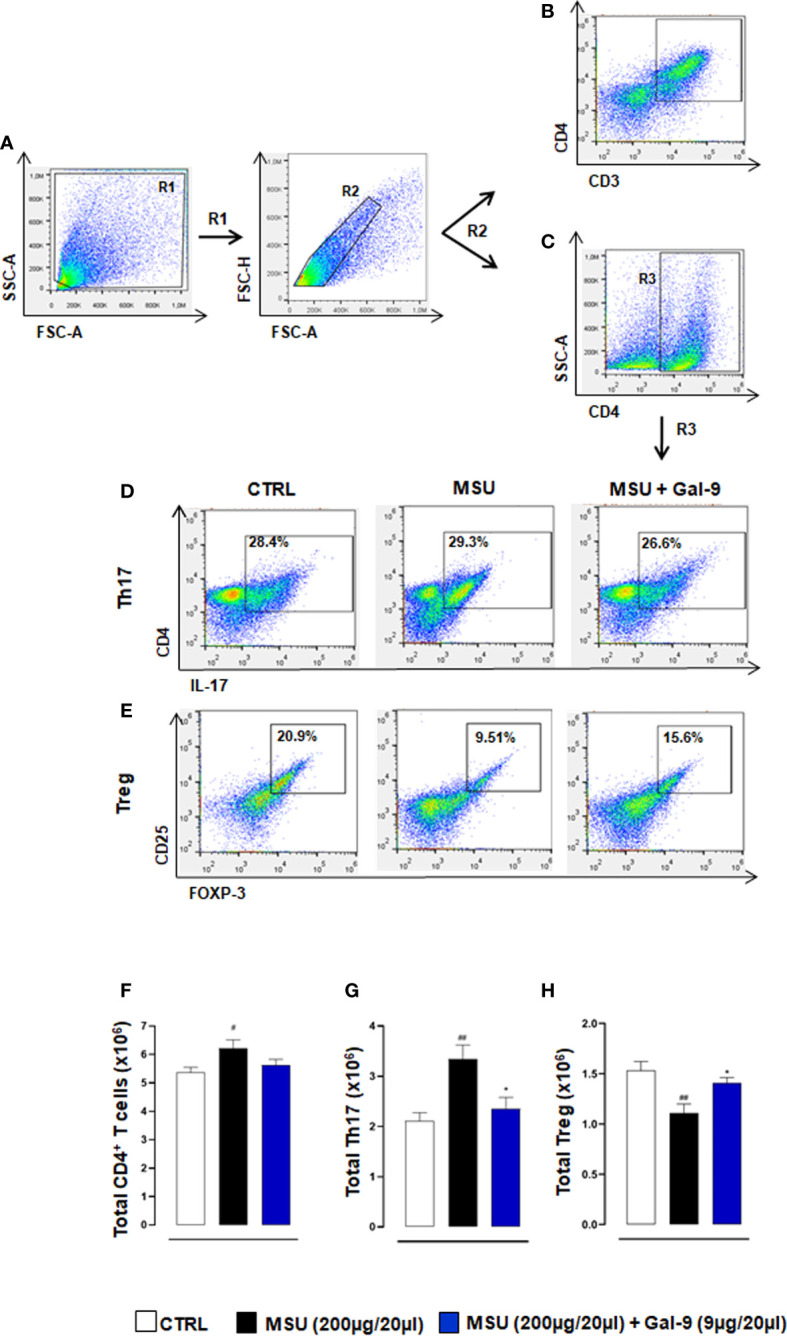
Figure 3.

Gal-9 sustains local Treg levels. Flow cytometry analysis was employed to determine in situ levels of CD4+ T cells, Th17 and Tregs subsets. At the peak of the inflammatory reaction (18h), ankle joints were digested, and single cell suspensions were obtained. Flow cytometry strategy applied to identify the modulation of CD3/CD4 (A, B), CD4+ T cells (A, C), Th17 (A, C, D) and Tregs (A, C, E) after Gal-9 treatment are shown. Cells were washed and stained with: CD3, CD4, CD25, and intracellular antibodies IL-17A and FOXP-3. Th17 and Treg populations were defined as CD4+/IL-17+ (A, C, D) and CD4+/CD25+/FOXP-3+ (A, C, E) respectively. (F) Total CD4+ T cells, (G) Th17 and (H) Tregs were quantified in the different experimental conditions. Representative FACS plots of three independent experiments with similar results are shown. Values are presented as means ± SEM of n = 6 mice per group. Statistical analysis was conducted by one-way ANOVA followed by Bonferroni’s test for multiple comparisons. #P ≤ 0.05, ##P ≤ 0.01 vs Ctrl group; *P ≤ 0.05 vs MSU group.
