Figure 5.
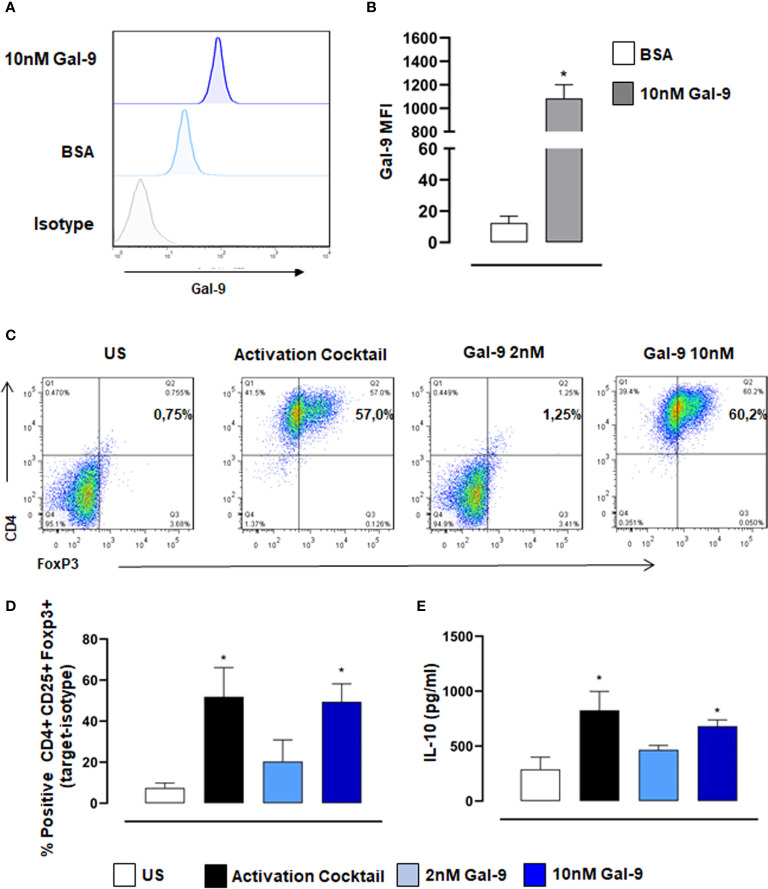
Gal-9 induces Treg differentiation of naïve human CD4+ T cells. CD4+ T cells were isolated from PBMCs and incubated with 10nM Gal-9 before staining with anti-Gal-9. (A) Representative histogram showing exogenous Gal-9 binding in CD4+ cells compared to isotype control levels. (B) Quantification of Gal-9 protein levels using median fluorescence intensity (MFI) of Gal-9. Data are expressed as mean ± SEM (n=4). Statistical analysis was performed with Students T-test; *P < 0.05 vs BSA. Naïve CD4+ T cells were differentiated with activation cocktail (CD3/CD28, IL2, TGFβ) or Gal-9 alone for 5 days. (C, D) Flow cytometry was used to measure % positive expression of CD4+,CD25+ and Foxp3+. (E) Cell culture supernatants were collected, and IL-10 levels were measured by ELISA. Data are expressed as mean ± SEM (n=3). Statistical analysis was performed with one-way ANOVA with Tukey multiple comparisons; *P < 0.05.

