
FIGURE 4.
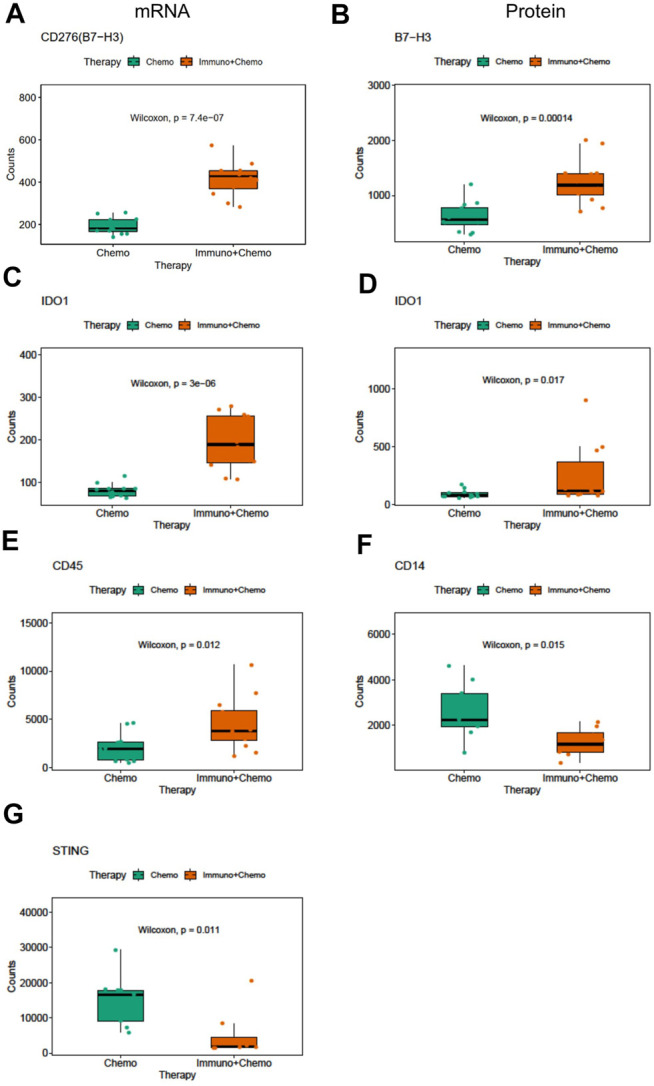
Differentially expressed mRNA and protein markers in tumor or stroma ROIs of chemotherapy or combinational therapy patients. Boxplots of CD276 mRNA (A) and protein (B) expression in the tumor ROIs of chemotherapy or combinational therapy patients (the Mann–Whitney test p < 0.05, non-adjusted). Boxplots of IDO1 mRNA (C) and protein (D) expression in the tumor ROIs of chemotherapy or combinational therapy patients (the Mann–Whitney test p < 0.05, non-adjusted). Boxplots of CD45 (E), CD14 (F), and STING (G) expression in the stroma ROIs of chemotherapy or combinational therapy patients (the Mann–Whitney test p < 0.05, non-adjusted).