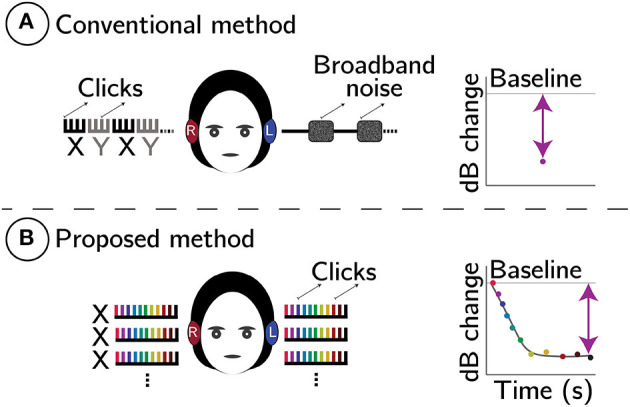
Figure 1.

Schematic comparison between conventional (A) and proposed (B) MOCR methods. In both panels, comb-like structures represent click trains. In (A), X (black) are baseline CEOAEs without, and Y (gray) are with contralateral noise elicitor, respectively. Plots on the right are predicted change in CEOAE level (dB). In (B), whole click-trains (X) are averaged and CEOAE inhibition is estimated using a two-term exponential fit to the change in CEOAE level, Δ, as a function of time. The line-fit also provides reflex kinetics (time-constants).
