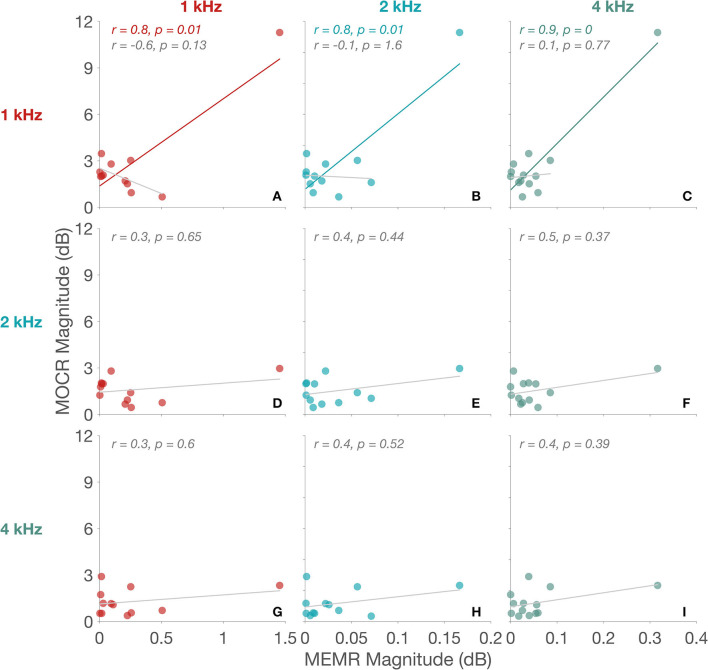
Figure 4.
MEMR vs. MOCR. Panels (A96I) separate 1/3rd octave-band frequencies. MEMR magnitude are along the x-axis and MOCR magnitude are along the y-axis in all panels. MEMR frequencies are differentiated in panel columns and MOCR frequencies in panel rows. Comparison frequencies in each panel are the two frequencies intersecting the specific panel [e.g., panel (A) compares both MOCR and MEMR magnitude at 1 kHz]. Significant fits are indicated by frequency specific colors and non-significant fits are in gray. Corresponding Pearson correlation coefficient (r) and the p-value are provided at the top of each panel.

