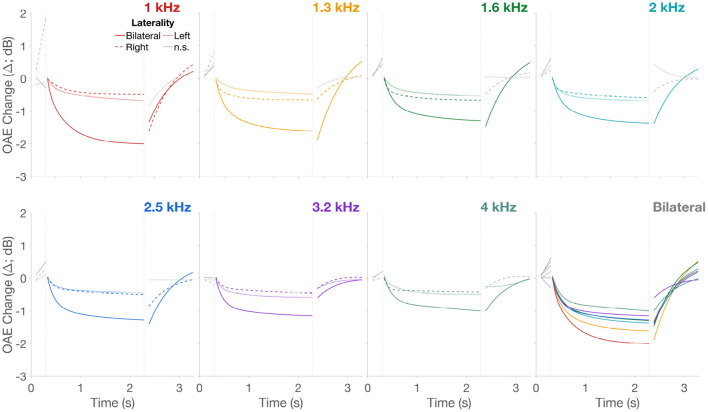
Figure 6.
CEOAE change over time. Only the fits from Figure 5 are plotted to allow direct comparison across the three lateralities. Unbroken lines are bilateral, dashed lines are right, and dotted lines are left ear stimulation, respectively. Panels are separated by frequency in addition to the different colors for the 7 frequencies. Lines in gray are non-significant fits. Fits across all frequencies, only for the bilateral stimulation, is presented in the last panel “Bilateral” to allow direct visual comparison of CEOAE Δ as a function of frequency.

