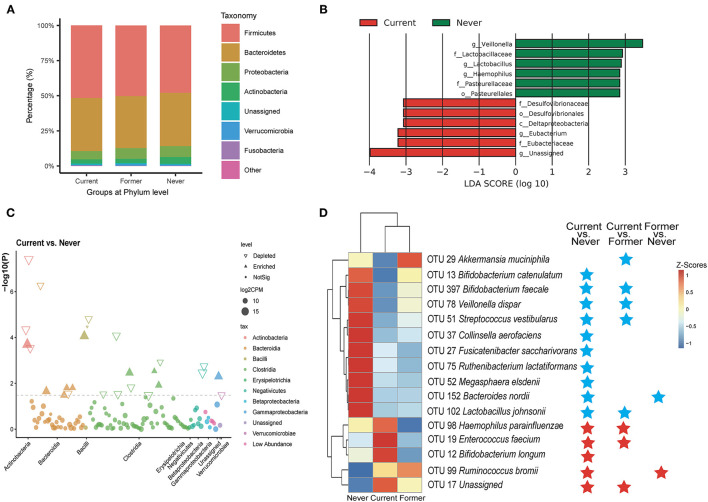
Figure 1.
Alterations in the composition of gut microbiota associated with smoking status. (A) Dominant phyla in each group. (B) Linear discriminant analysis (LDA) effect size (LEfSe) analyses of the differential taxa between current and never smokers. (C) A Manhattan plot showing the distribution of differential taxa. (D) A heatmap illustrating the relative abundance of smoking-associated operational taxonomic units (OTUs) across the three groups. A threshold of FDR < 0.05 calculated by the edgeR test was considered statistically significant. Blue stars indicate the depleted OTUs in comparison; red stars indicate the enriched OTUs.

