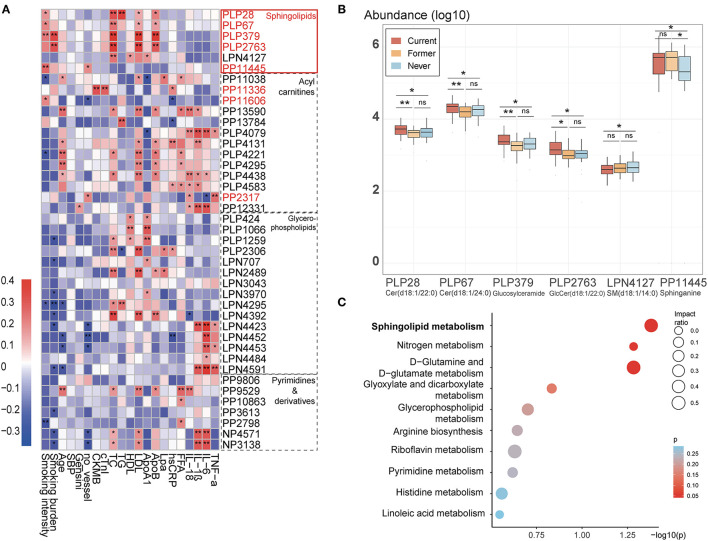
Figure 3.
Changes of four groups of important smoking-associated serum metabolomic features. (A) Spearman correlations between smoking-associated metabolomic features in four main groups and major risk factors for CAD. The IDs of metabolic features highlighted in red are smoking-positive. Lpa, lipoprotein (a); ApoB, apolipoprotein B; FFA, free fatty acid; ApoA1, apolipoprotein A1. There is a remarkable elevation in sphingolipids, which is correlated with CAD phenotypes. *p < 0.05, **p < 0.01. (B) Relative abundance of six metabolites belonging to the class of sphingolipids among three groups. ns: not significant, *p < 0.05, **p < 0.01, Mann-Whitney U test. (C) Pathway analysis of differential metabolites (Current vs. Never smokers).

