
FIGURE 1.
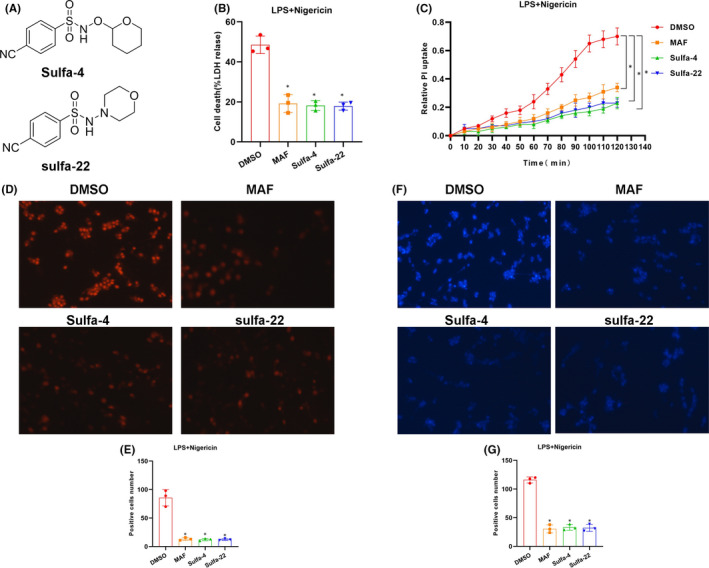
Sulfa4/22 on pyroptosis in BV2 cells. (A) The structure of Sulfa‐4 and Sulfa‐22 compounds. (B) Results of LDH release rate (n = 5): The LDH release rate was relatively high in the DMSO group, which was down‐regulated in the MAF and Sulfa‐4/22 groups decreased. Comparison with the DMSO group, *p<0.05. (C) of PI uptake rate (n = 3): The PI uptake rate was relatively high in the DMSO group, which was decreased in the MAF and Sulfa‐4/22 groups. Comparison with the DMSO group, *p < 0.05. (D‐E) PI staining (n = 5): Positive cells were significantly higher in the DMSO group than that of MAF and Sulfa‐4/22 groups. Comparison with DMSO group, *p < 0.05. (F‐G) Hoechst 33258 staining (n = 5): Positive cells was significantly higher in the DMSO group than that of MAF and Sulfa‐4/22 groups. Comparison with DMSO group, *p < 0.05