
FIGURE 3.
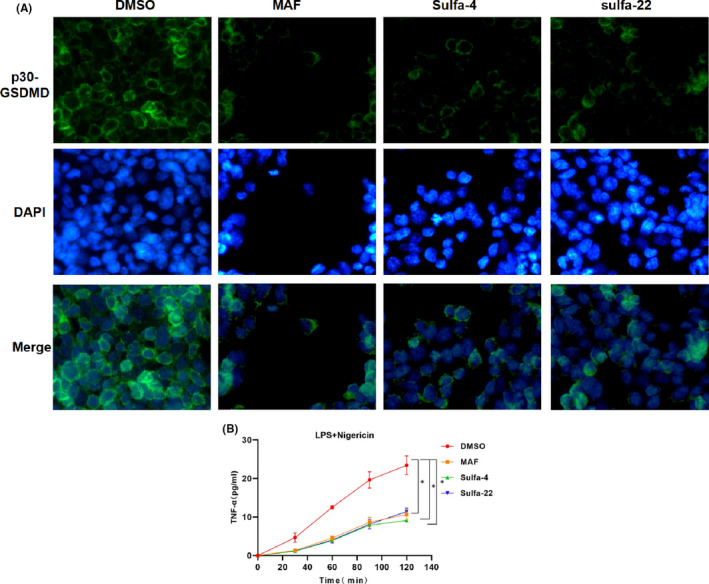
Sulfa4/22 on p30‐GSDMD and TNF‐α release. (A) p30‐GSDMD IF staining (n = 5): p30‐GSDMD was relatively high in the DMSO group, while p30‐GSDMD protein was significantly down‐regulated in the MAF and Sulfa‐4/22 groups, indicating the suppressed cleavage of GSDMD. (B‐C) Results of TNF‐α release (n = 3): The release of TNF‐αwas up‐regulated in the DMSO group, which was down‐regulated in the MAF and Sulfa‐4/22 groups. Comparison with the DMSO group, *p < 0.05