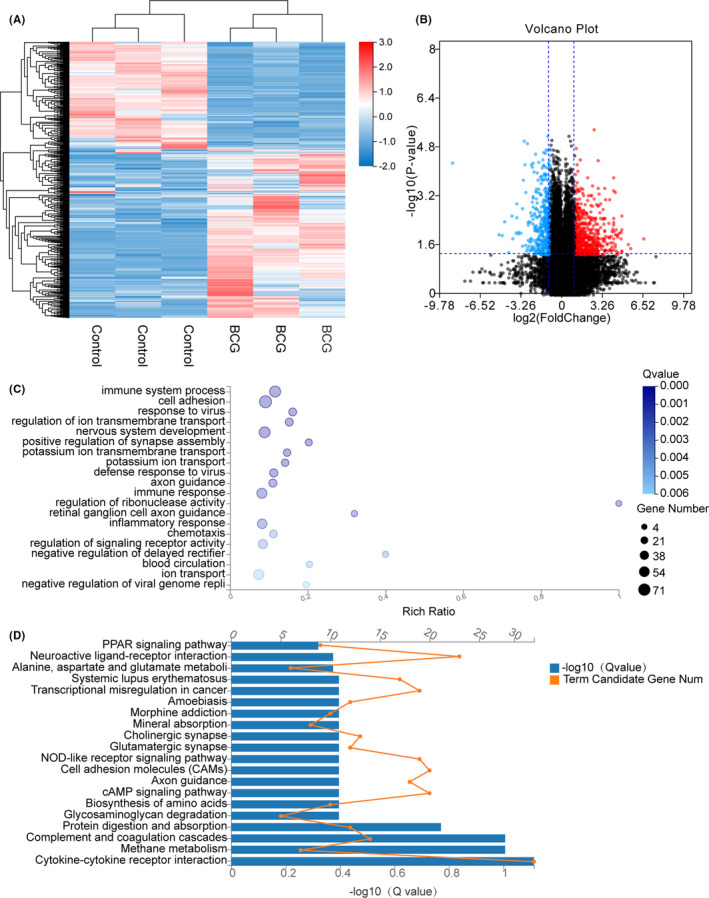
FIGURE 5.

Enrichment analysis of THP‐1‐infected BCG strain DEGs in high‐throughput RNA sequencing. A, The heat map showing the relative transcript levels of the differential genes in THP‐1 cells uninfected and infected with BCG Mycobacterium tuberculosis strains displays the expression pattern changes after infection. B, Volcano plot showing considerably up‐regulated (red dots) and down‐regulated genes (blue dots). C, NC vs BCG GO biological process enrichment analysis of significant DEGs. D, NC vs BCG KEGG pathway enrichment analysis of significant DEGs
