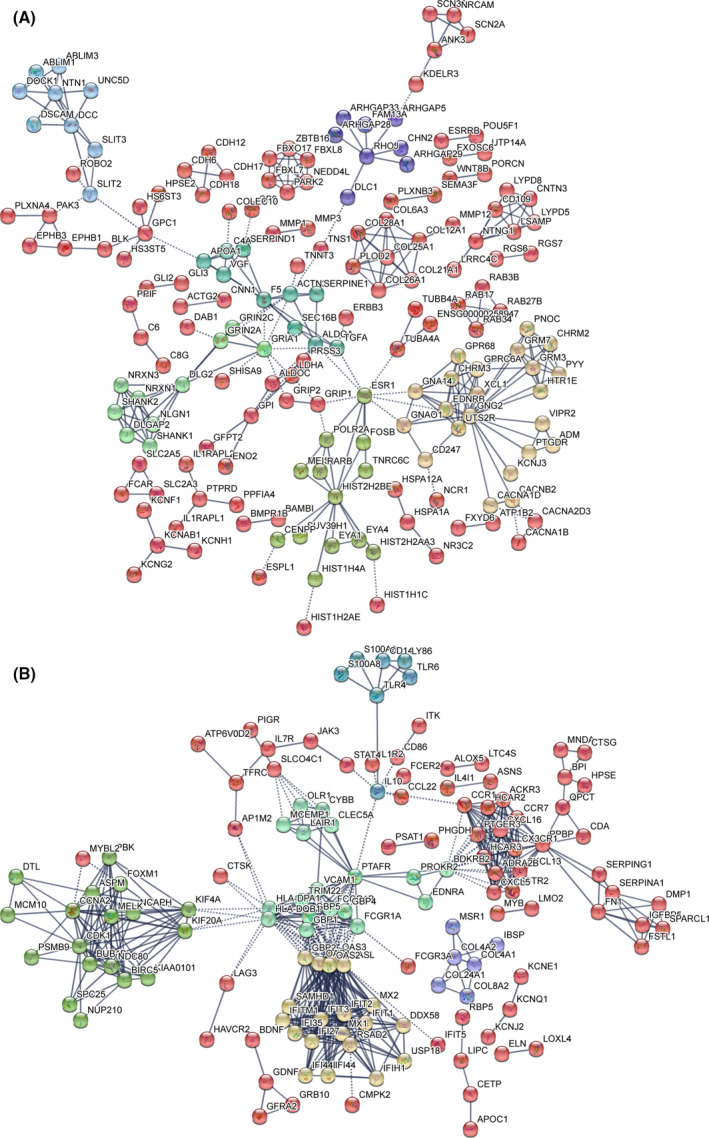
FIGURE 6.

DEGs PPI networks. A, PPI network showing the up‐regulated DEGs from infected BCG strain group compared with the control group. B, PPI network showing the down‐regulated DEGs from infected BCG strain group compared with the control group. The colour representation K means clustering (network is clustered into a specified number of clusters)
