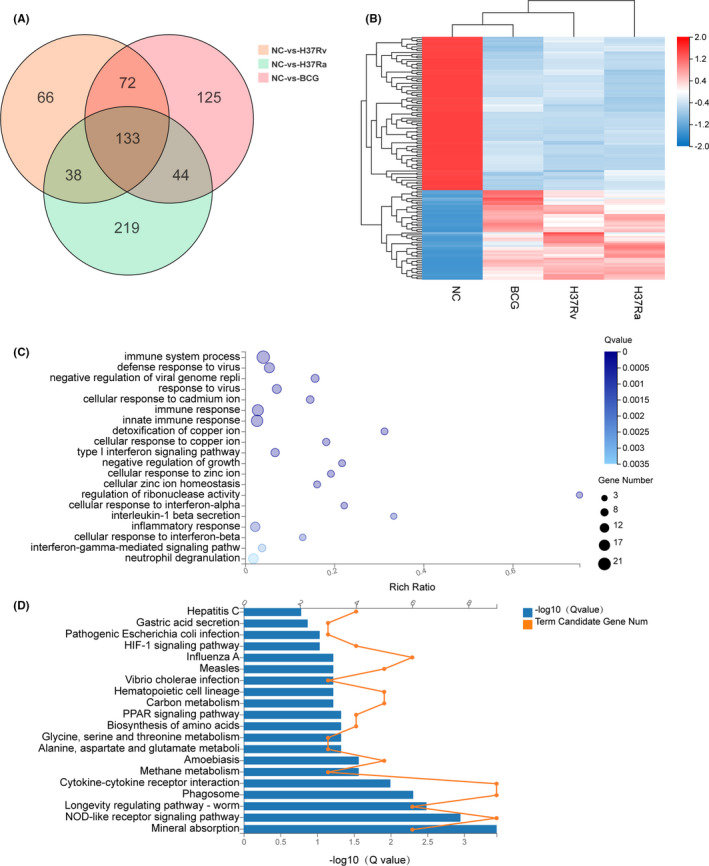
FIGURE 7.

The heat map, Venn diagram, GO and KEGG classification of the DEGs screening. A, Shows the number of DEGs in three different datasets and the crossing area indicates the cross‐DEGs in different datasets. Including NC vs H37Rv (orange), NC vs H37Ra (green) and NC vs BCG (red). B, The heat map shows the relative transcript levels of the 133 differential genes in THP‐1 cells infected with Mycobacterium tuberculosis H37Rv, HA36Ra and BCG strains. C, Common 133 differential genes GO biological process enrichment analysis of significant DEGs. D, Common 133 differential genes KEGG pathway enrichment analysis of significant DEGs
