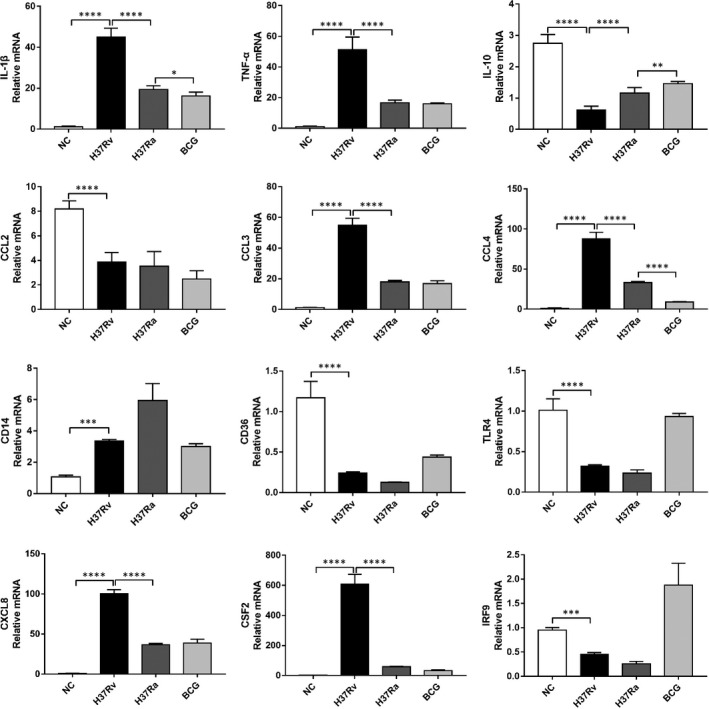
FIGURE 9.

Comparative analysis of pro‐inflammatory factors and immune regulatory gene expression in different strains of MTB‐infected THP‐1 cells by Q‐PCR. H37RV, H37Ra and BCG‐infected THP‐1cell mRNA was extracted, and the expression abundance of IL‐1β, TNF‐α, IL‐10, CCL2, CCL3, CCL4, CD14, CD36, TLR4, CXCL8, CSF2 and IRF9 was determined by RT‐qPCR. The comparative analysis of transcriptional expression levels of these cytokines, chemokines and immune regulatory factors was assessed and shown in the graph. Data are expressed as the mean ± SD; *p < 0.05, **p < 0.01, ***p < 0.001, ****p < 0.0001
