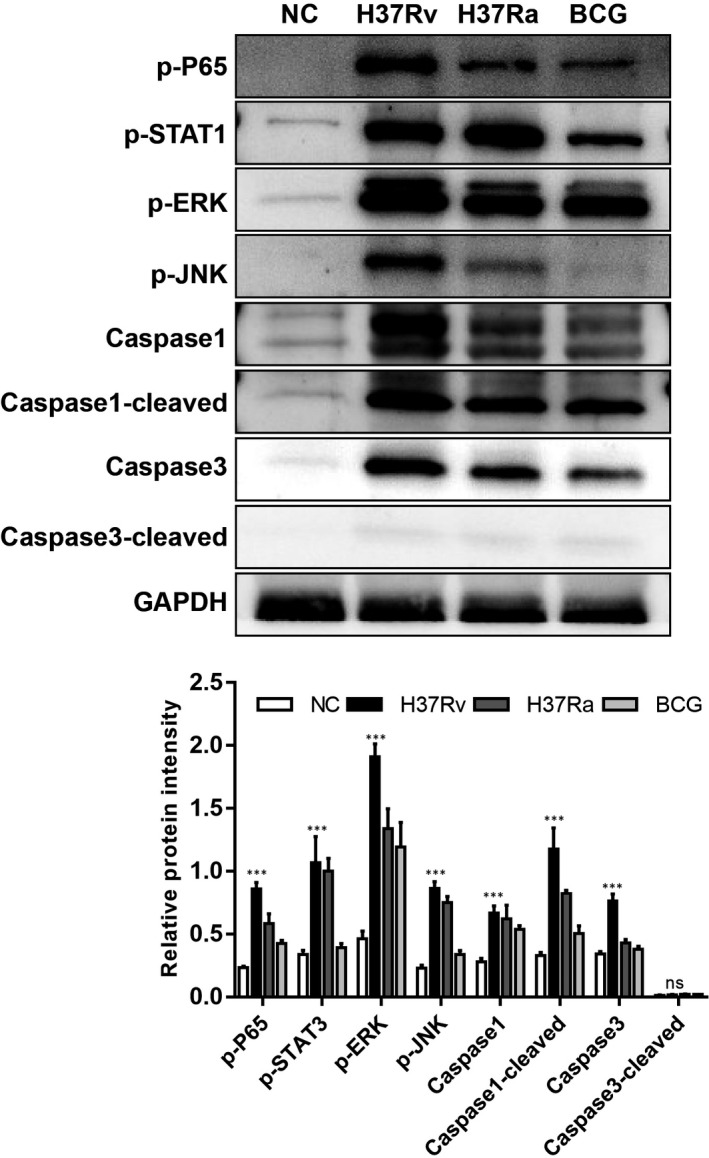
FIGURE 10.

Detection of the signalling transduction pathway activation in different strains of MTB‐infected THP‐1 cells by Western blot. A, The protein expression of p‐P65, p‐STAT1, p‐ERK, p‐JNK, Caspase‐1, Cleaved‐Caspase‐1, Caspase‐3, Cleaved‐Caspase‐3 and GAPDH in different strains of MTB‐infected THP‐1 cells was assessed by Western blot. B, The graph shows the comparison of the relative intensity of the protein expression in the Western blot; the relative intensity of each band was calculated after normalization with the intensity of GAPDH in a blot, *p < 0.05, **p < 0.01, ***p < 0.001, ****p < 0.0001
