
Figure 3 .
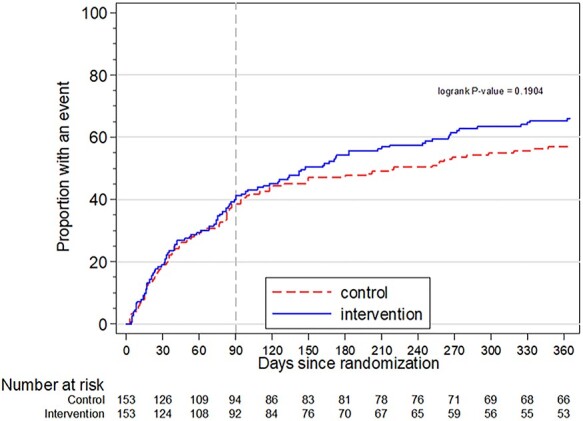
Kaplan–Meier curve of the composite outcome within 12 months. Dashed line at 90 days marks the end of the intervention period. The curves of the intervention and control group in the primary outcome diverged after the intervention was completed at 90 days follow-up.