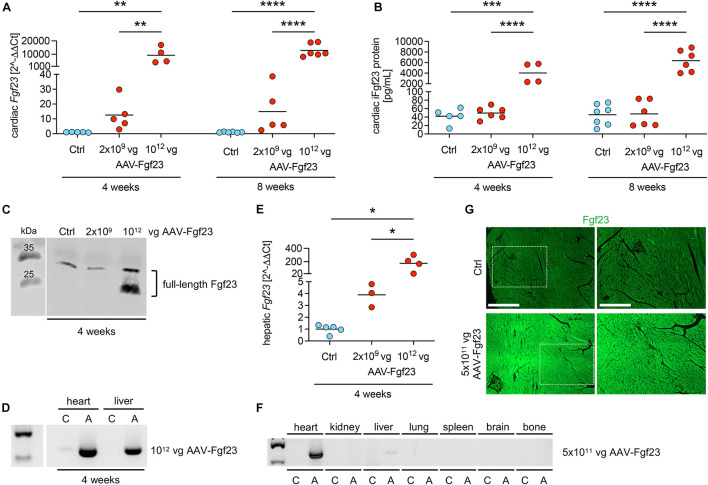
FIGURE 1.
Dose- and time-dependent evaluation of AAV-Fgf23. (A) Relative cardiac Fgf23 mRNA expression is dose-dependently increased in AAV-Fgf23 mice compared to Ctrl, irrespective of the duration of exposure. (B) ELISA-based quantification of cardiac Fgf23 protein in heart tissue lysates shows increased intact Fgf23 (iFgf23) protein only in AAV-Fgf23 mice administered with 1012 vector genomic particles (vg) compared to Ctrl. (C) Representative immunoblotting of Fgf23 in cardiac tissue demonstrates increased iFgf23 protein in the 1012 vg AAV-Fgf23 group after 4 weeks compared to Ctrl. (D) Semi-quantitative PCR targeting AAV vector shows excessive virus transduction after 4 weeks in the heart and the liver of 1012 vg AAV-Fgf23 mice (A) compared to Ctrl (C). (E) Hepatic Fgf23 mRNA expression is significantly increased after 4 weeks in 1012 vg AAV-Fgf23 mice compared to Ctrl. (F) By injecting 5 × 10¹¹ vg AAV-Fgf23, semi-quantitative PCR targeting AAV vector shows distinct virus transduction in the heart compared to Ctrl, whereas transduction in liver tissue was very low and absent in kidney, lung, spleen, brain, and bone tissue. (G) Immunofluorescent staining of cardiac mid-chamber sections demonstrates uniform Fgf23 (green) overexpression in almost all cardiac myocytes of the left ventricle in AAV-Fgf23 mice compared to Ctrl (original magnification ×20; scale bar, 500 and 250 μm, respectively). Data are given as scatter dot plots with means; *p < 0.05, **p < 0.01, ***p < 0.001, and ****p < 0.0001 analyzed using one-way ANOVA or Kruskal–Wallis test followed by Sidak’s or Dunn’s multiple comparisons post hoc tests, respectively, according to Shapiro–Wilk normality test; n = 3–7 mice per group.

