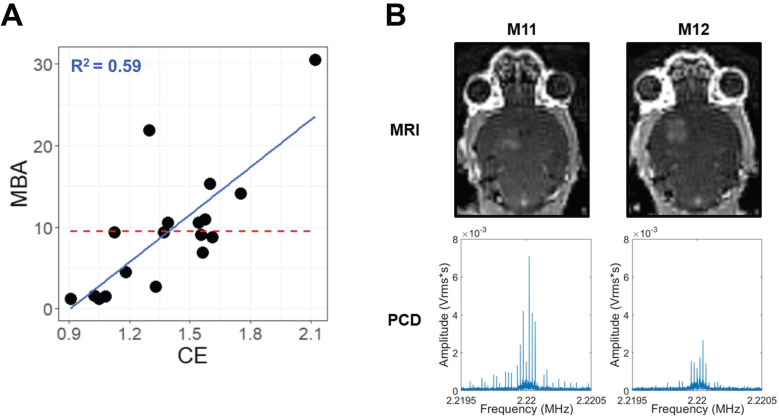
Figure 1.
MBA and CE are not collinear. (A) Scatter-plot for all samples with paired CE and MBA data. The solid blue line and text represent linear regression, while the dashed red line represents the MBA mean, simulating a null linear fit. (B) Paired T1-weighted contrast-enhanced 3T MRI images (top) and PCD traces in the Fourier domain around the 2nd harmonic (bottom) for 2 different mice (M11 and M12) during FUS BBBD treatment within a single experiment. Comparison of M11 and M12 illustrates that the relative magnitudes of MBA and CE can vary markedly from treatment to treatment.

