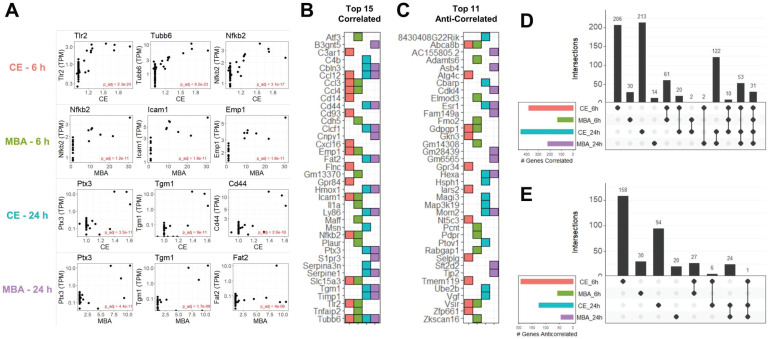
Figure 3.
CE and MBA predict significant gene expression 6 h and 24 h after FUS BBBD. (A) Scatter-plots of TPM normalized expression for the top 3 genes predicted by CE or MBA at 6 h or 24 h after treatment. (B) Tile chart representing the top 15 genes predicted in each pool. Note that the absence of a tile for a particular pool-gene combination does not necessarily mean the gene is not significantly correlated, just that it is not in the top 15. (C) Tile chart representing the top 11 anti-correlated genes from each pool, with the same conditions as in B. (D) Upset plot indicating gene identity overlaps of positively correlated genes from each pool. (E) Upset plot indicate gene identity overlaps of anti-correlated genes from each pool.

