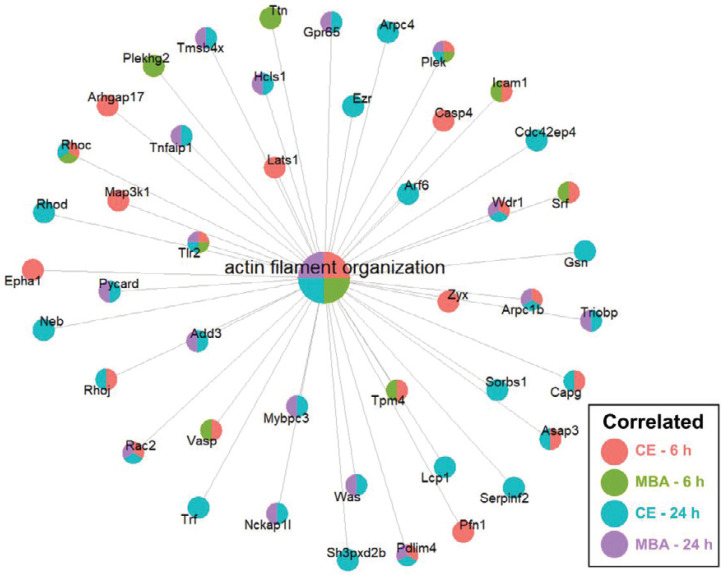
Figure 5.
CE and MBA robustly predict enrichment of genes associated with actin filament organization. Integrated gene concept network for the actin filament organization pathway, which was significantly enriched across all 4 pools. Each dot, representing a contributing gene, is color coded as a pie-chart representing pools in which that gene is significantly correlated.

