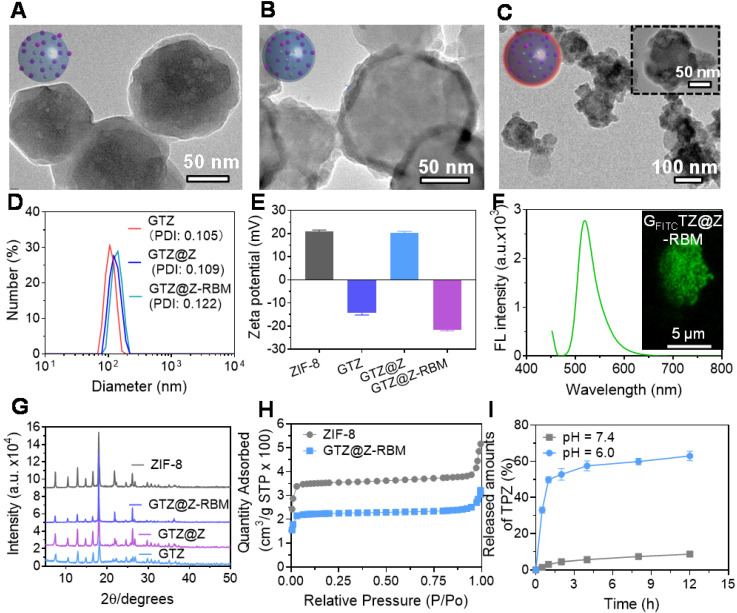
Figure 2.
Characterization of GTZ@Z-RBM NPs. TEM images of (A) GTZ NPs, (B) GTZ@Z NPs, and (C) GTZ@Z-RBM NPs. (D) Recorded hydrodynamic sizes and (E) Zeta potential of GTZ, GTZ@Z, and GTZ@Z-RBM measured by dynamic light scattering (DLS). (F) Fluorescence spectrum of GFITCTZ@Z-RBM NPs, inset shows the confocal laser scanning microscopy (CLSM) image of GFITCTZ@Z-RBM NPs. (G) XRD patterns of ZIF-8, GTZ, GTZ@Z, and GTZ@Z-RBM. (H) N2 isotherms of ZIF-8 and GTZ@Z. (I) TPZ released from GTZ@Z NPs at pH = 7.4 and 6.0 in PBS.

