Figure 2.
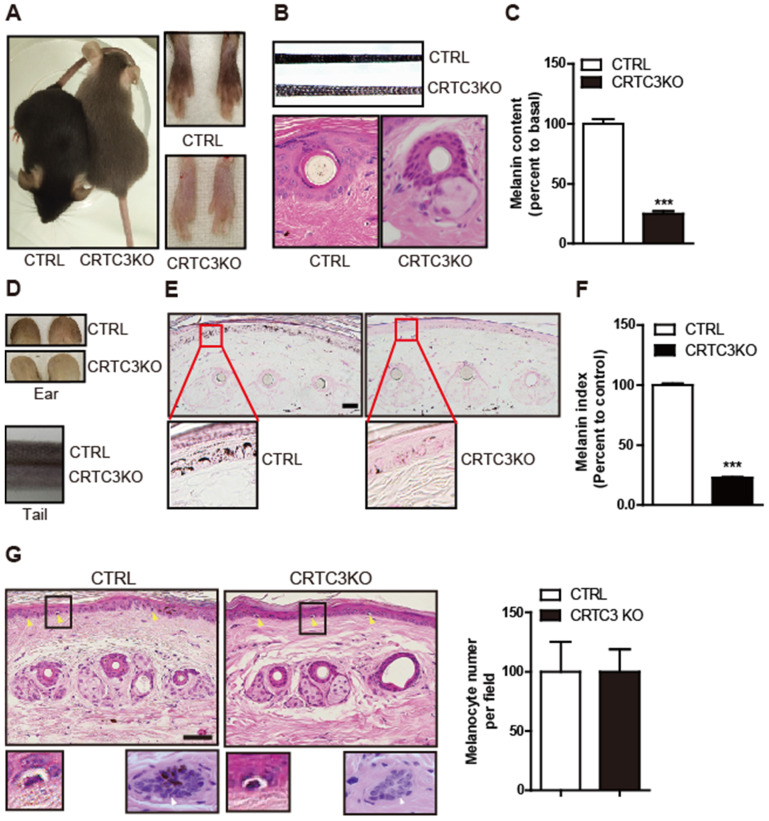
Light coat color and hypopigmented skin of CRTC3 null mice. (A) Comparison of coat color between 2-month-old control (WT: CTRL) and CRTC3 null mice. (B) Microscopic images of hair and hair follicle and, (C) quantification of melanin content in dorsal hair from CTRL and null mice. (n=3 for each group). (D) Comparison of the skin color of ear and tail between CTRL and CRTC3 null mice. (E) Epidermal melanosomes visualized by Fontana-Masson staining (Bar = 50 µm) and (F) melanin index. (G) Microscopic images of epidermal melanocytes (yellow arrow), close-up pictures of melanocytes (lower left panel), and hair follicles (melanin deposition) (lower right panel) in tail skin of CTRL and CRTC3 null mice and melanocyte number per field denoted by percent to that of CTRL mice (Bar = 50 µm).

