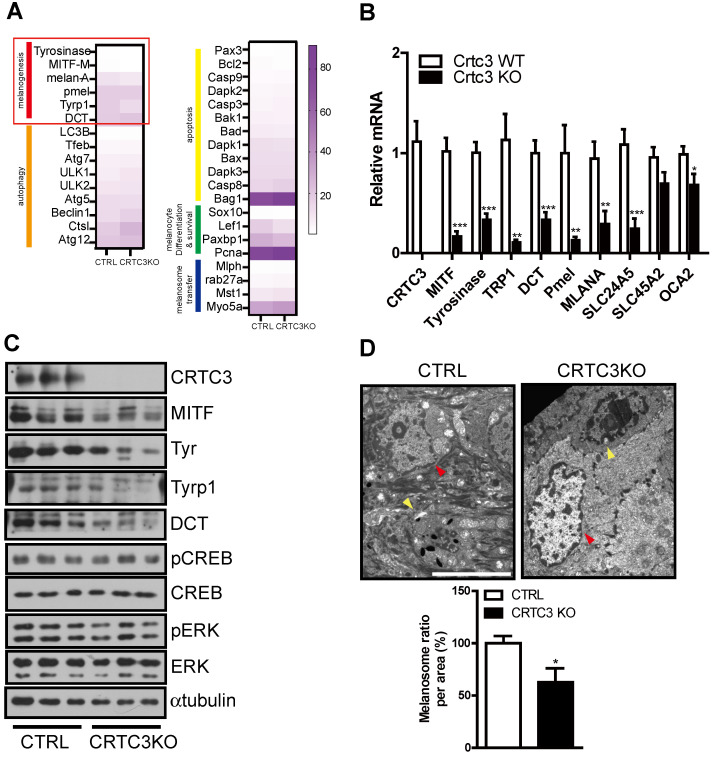
Figure 3.
Downregulation of melanogenic program in CRTC3 null mice. (A) Heatmap of differentially expressed genes by RNA sequencing experiments in tail skin of 2-month-old CTRL and CRTC3 null mice. (B) The mRNA (n=4 for each group) and (C) protein levels of melanocyte-relevant genes in tail skin of 2-month-old CTRL and CRTC3 null mice. (D) Electron microscopic images of epidermal cells and melanosomes in CTRL and CRTC3 null mice tail tissue. The yellow and red arrowheads indicate melanocyte and keratinocyte, respectively. Melanosome number is expressed ratio per area in CTRL and CRTC3 null mice (Bar = 5 µm).

