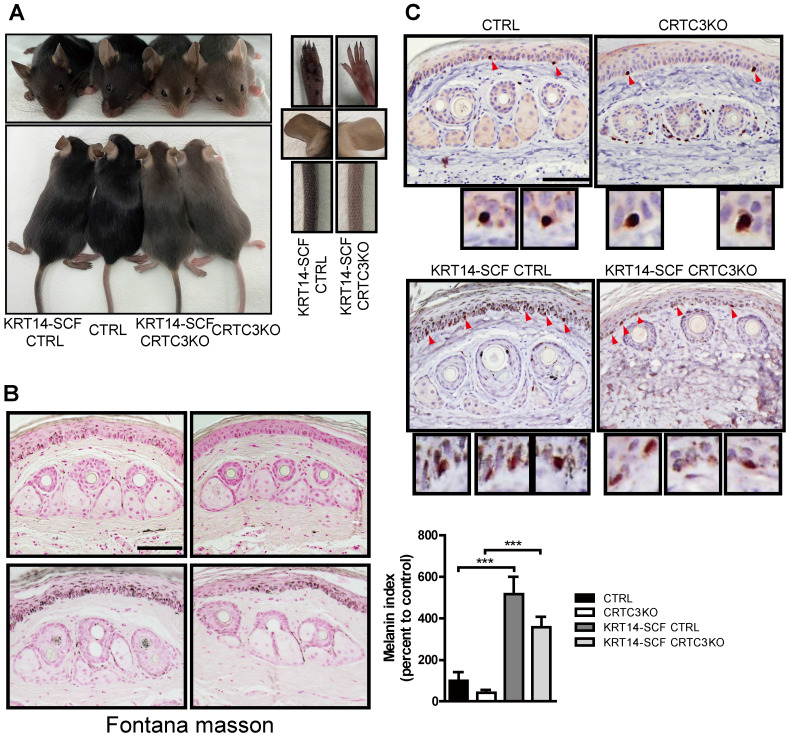
Figure 7.
Light skin color in a CRTC3 null mouse model of humanized skin. (A) Skin color comparison of CRTC3 null mice crossed with KRT14-SCF transgenic mice compared to CTRL mice crossed with KRT14-SCF transgenic mice, CTRL, and CRTC3 null mice. (B) Microscopic images (left panel) and melanin index (right panel) of epidermal melanin deposition assessed by Fontana-Masson staining in tail skin from CTRL, CRTC3 null mice, CTRL mice crossed with KRT14-SCF transgenic mice, and CRTC3 null mice crossed with KRT14-SCF transgenic mice. (C) Immunohistochemistry using SOX10 antibodies for melanocytes in the tail skin of CTRL, CRTC3 null mice, control crossed with KRT14-SCF transgenic mice, and CRTC3 null mice crossed with KRT14-SCF transgenic mice. Red arrows indicate SOX10+ epidermal melanocytes. Low panels show close-up view of SOX10+ melanocytes (Bar = 50 µm).

