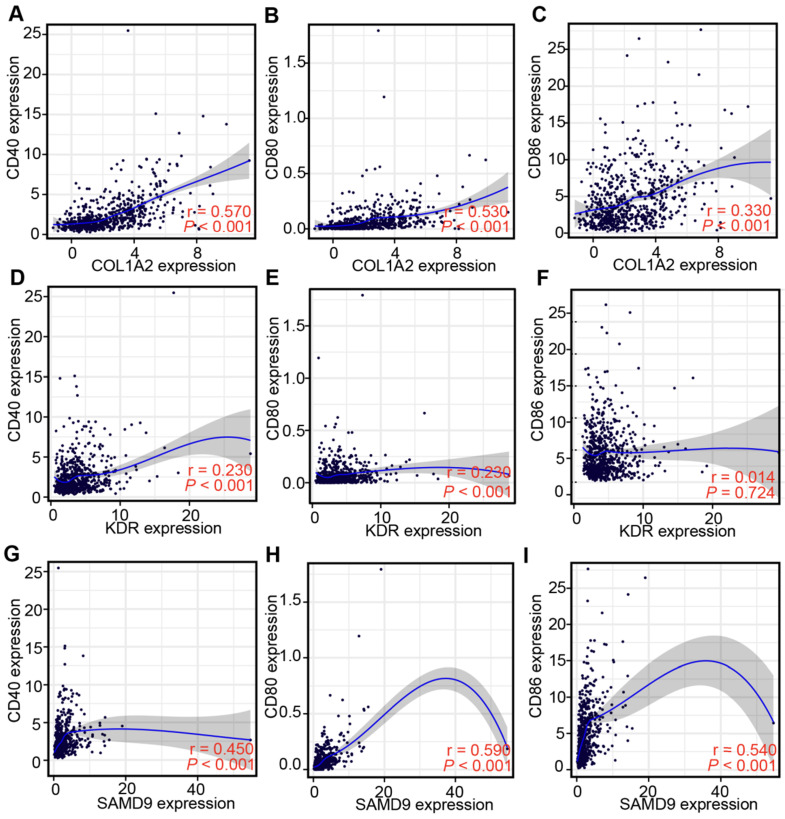
Figure 4.
Correlation between the expression levels of three antigens and those of APC markers in the TCGA diffuse glioma cohort. (A-C) Correlation between the expression levels of COL1A2 and those of CD40 (A), CD80 (B), and CD86 (C). (D-F) Correlation between the expression levels of KDR and those of CD40 (D), CD80 (E), and CD86 (F). (G-I) Correlation between the expression levels of SAMD9 and those of CD40 (G), CD80 (H), and CD86 (I). Correlations were determined by the Spearman's test, and P < 0.05 was considered significant.

