Figure 4.
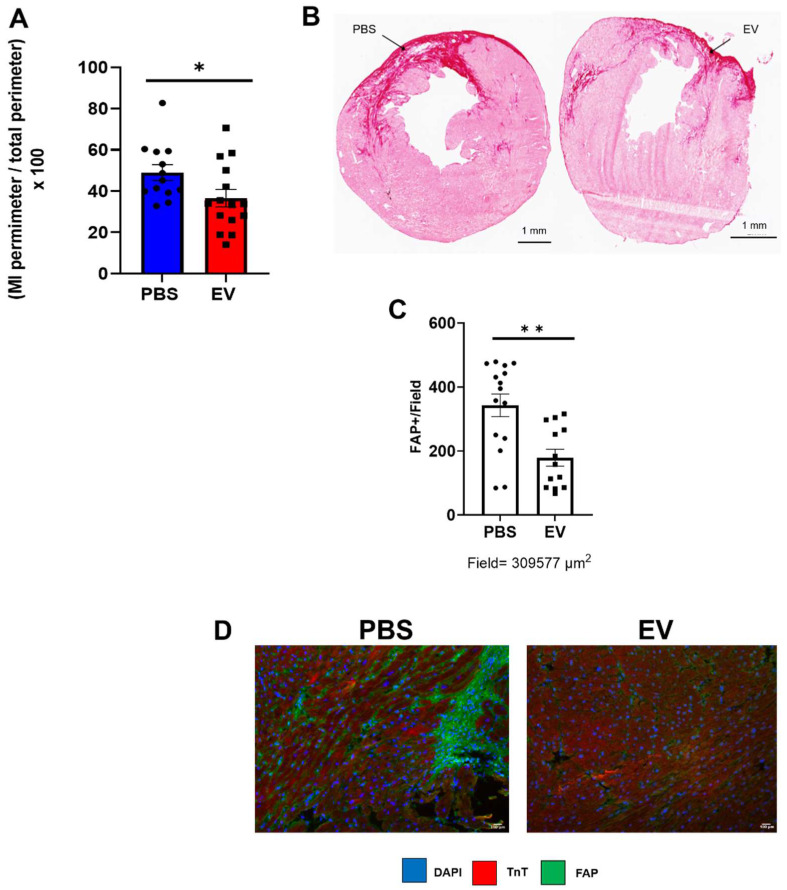
Effect on EV-CPC on fibrosis in MerCreMerZEG mice. A. Infarct size expressed as a ratio between the perimeter of the infarct and the total perimeter of the section (H&E staining). For this end point, there were 15 and 13 mice in the EV and PBS groups, respectively. B. Representative images of the infarct area in a control and an EV-treated heart (Sirius red staining). Arrows point to infarcted area. C. Quantification of Fibroblast Activated Protein (FAP) in peri-infarcted area in EV-CPC (n = 13) and PBS (n = 15) injected hearts. D. Representative immunostaining for FAP (green) and cardiac Troponin T (red) in the left ventricular free wall section of a PBS-injected control heart and a EV-injected heart. (20X). *p ≤ 0.05 **p ≤ 0.005.

