Figure 5.
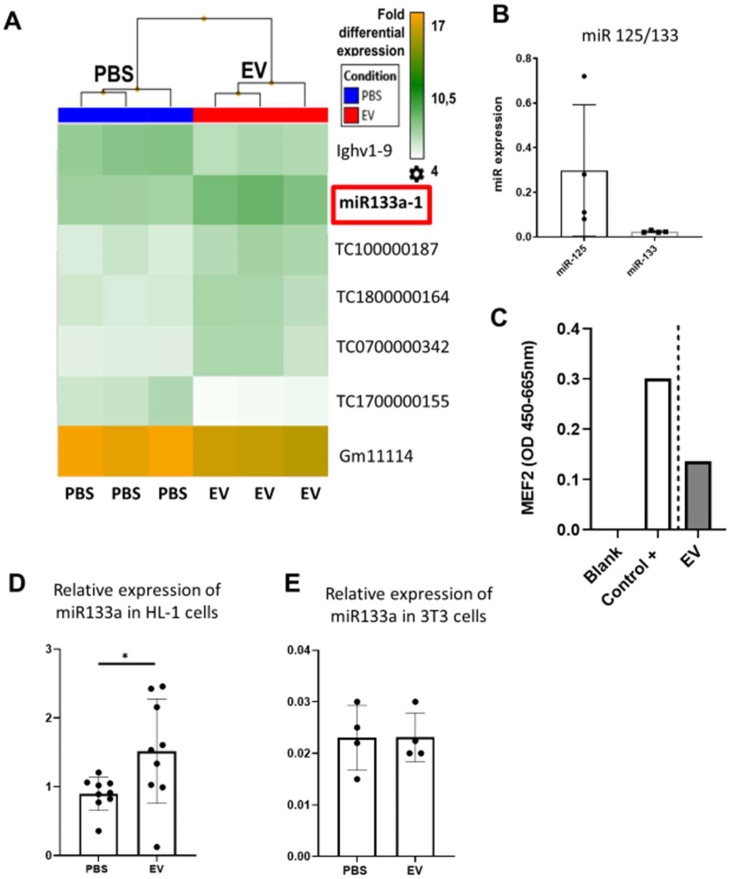
Effects of EV-CPC on transcriptomics in MerCreMerZEG mice. A. Hierarchical clustering of the Whole Transcript (WT) Expression Arrays was performed using mRNAs from control and treated hearts and differentially expressed genes (DEG) were selected using one-way analysis of variance (ANOVA). The fold change (FC) of every gene, together with their corresponding p-value, were used for selection of DEGs with a cut-off of 2.0. (n = 3/group). B. Expression levels of miR-133 in EV-CPC. miR125 was taken as the reference. C. Expression of MEF2 in EV-CPC. The control was nuclear extracts provided by the manufacturer (2 technical replicates). D. Expression levels of miR-133a in HL-1 cells treated with PBS or EV after incubation for 24 h. E. Expression levels of miR-133a in 3T3 cells treated with PBS or EV after incubation for 24 h.

