Figure 2.
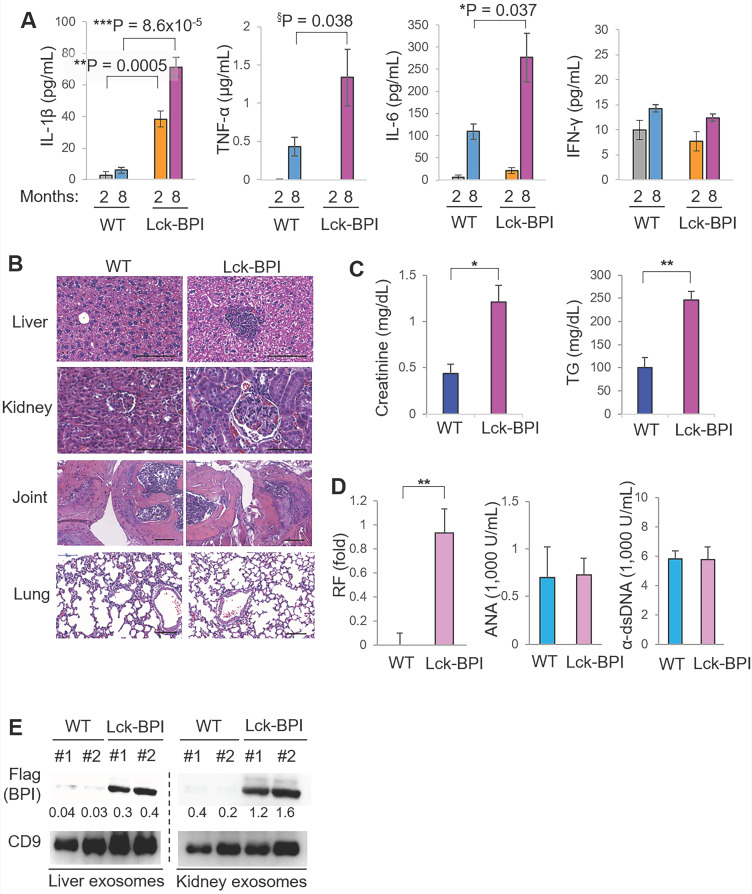
Lck-BPI transgenic mice spontaneously develop inflammatory phenotypes. (A) ELISA of serum IL-1β, TNF-α, IL-6, and IFN-γ, from 2-month-old mice (WT, n = 4; Lck-BPI, n = 4) or 8-month-old mice (WT, n = 3; Lck- BPI, n = 6). Means ± SEM are shown. *, P value < 0.05; **, P value < 0.01; ***, P value < 0.001 (two-tailed Student's t-test); §, P value < 0.05 (one-tailed Student's t-test). (B) Hematoxylin and eosin (H&E)-stained sections of the liver, kidney, and joint from 8-month-old Lck-BPI Tg and WT mice. Scale bars, 100 µm. For the liver, the immune cell aggregation regions were presented as the ratio of aggregation area divided by the entire view area. WT, 5.4 ± 7.1 x 10⁻⁵; Lck-BPI Tg, 1.8 ± 3.6 x 10⁻². Data shown are mean ± SD of 5 images. For the kidney, the diameters of glomeruli were 60.1 ± 10.7 µm for WT mice and 92.6 ± 10.58 µm for Lck-BPI Tg mice. The mesangial cell numbers were 50.5 ± 12.5/glomerulus for WT mice and 82.5 ± 15.8/glomerulus for Lck-BPI Tg mice. Data shown are mean ± SD of 10 glomeruli. (C) Serum creatinine and triglyceride (TG) of 36-week-old wild-type or Lck-BPI transgenic mice were determined using serum chemistry assays. n = 5 per group. (D) ELISA of serum anti-nuclear antibody (ANA), rheumatoid factor (RF), and anti-dsDNA antibody in wild-type and Lck-BPI Tg mice. (E) Immunoblotting analysis of Flag-tagged BPI and CD9 protein levels in exosomes isolated from the liver (left panel) or kidney (right panel) tissues. Relative fold changes (means of three independent experiments) were normalized to CD9 levels and are shown at the bottom of the Flag panel. Data shown (A-E) are representatives of three independent experiments.

